
Solana dips with bearish bias intact, likely to consolidate between $71.50 and $85.00 amid heavy seller pressure – weekly review

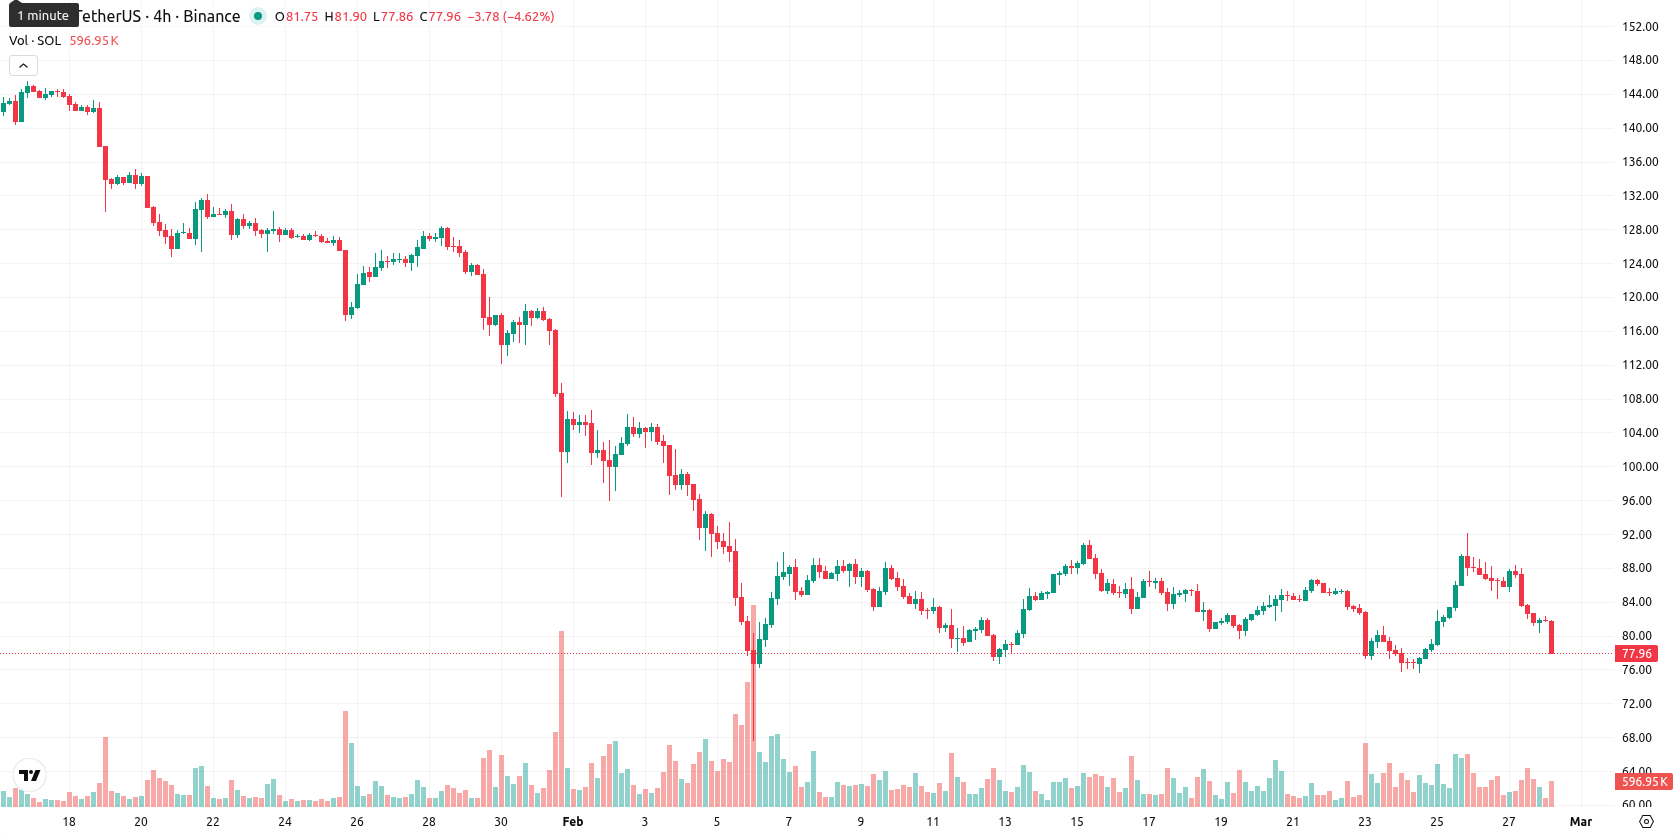
Solana (SOL) is currently trading at $78.69, down $8.62, or 9.87% over the past week. The asset remains well below its W1 MA-20 at $83.69, MA-50 at $106.86, and MA-200 at $158.00, indicating persistent bearish momentum and pressure from sellers across all key timeframes.
Highlights
- Solana (SOL) is trading at $78.69, significantly below its MA-20 ($83.69), MA-50 ($106.86), and MA-200 ($158.00), indicating sustained bearish pressure across all timeframes.
- Momentum indicators remain negative with the MACD and Stochastic RSI signaling 'Strong Sell,' while the ADX D1 at 44.21 confirms a pronounced downward trend.
- SOL faces immediate resistance at the Ichimoku Kijun of $86.81, with key support around $71.50; probability of further decline exceeds 80% over the next five trading days.
Ecosystem growth and inflows persist despite price weakness this week
Solana saw the launch of the Solana Payments Hub, enabling efficient on-chain payments as stablecoin transfers on the network exceeded $2 trillion in quarterly volume and over $300 million monthly, with transaction fees remaining minimal. SoFi became the first nationally chartered US bank to allow direct SOL deposits, opening access to its 13.7 million users. Meanwhile, despite recent price weakness, institutional inflows into related Solana ETFs have continued, and key holders with unrealized losses maintain long-term confidence in the ecosystem.
Bearish signals intensify as technicals confirm strong downward momentum
Weekly technicals reinforce a bearish setup, with SOL's price pinned below all major moving averages: MA-20 ($83.69), MA-50 ($106.86), and MA-200 ($158.00), signaling downward pressure over short, medium, and long-term horizons. The nearest dynamic resistance aligns with the Ichimoku Kijun at $86.81, with no immediate key support on the weekly chart below the current price. The MACD remains on a "Strong Sell" signal and the ADX W1 confirms a robust downtrend, while the RSI has slipped to 28.87, firmly in oversold territory. Other oscillators, including the Stochastic RSI and CCI, signal persistent bearishness, suggesting limited buyer conviction near these levels.
Bearish outlook holds as consolidation and downside risks loom next week
For the next 5–7 trading days, SOL is likely to consolidate between $71.50 and $85.00, reflecting a typical 10% swing based on current volatility and weekly indicators. The probability of further declines remains above 80%, given the dominant negative momentum and lack of technical support nearby. A move above $86.81 would be needed for a bullish reversal toward $90.00, while a breakdown below $71.50 could accelerate losses into the $68.00–$70.00 zone. The weekly outlook therefore favors a continued bearish bias, with only a slim chance of meaningful relief in the near term.
Previously it was reported that Solana is trading below all major moving averages, with technical indicators such as the MACD, ADX, RSI, and Stochastic RSI confirming a strong bearish trend and emerging oversold conditions. Immediate resistance stands at $86.81, while price action favors continued consolidation or downside within the $73.00–$86.00 range over the next five days.


Latest Solana News


-
 Afghanistan
-
 Albania
-
 Algeria
-
 Angola
-
 Argentina
-
 Armenia
-
 Australia
-
 Austria
-
 Azerbaijan
-
 Bahamas
-
 Bahrain
-
 Bangladesh
-
 Belarus
-
 Belgium
-
 Bolivia
-
 Botswana
-
 Brazil
-
 Brunei
-
 Bulgaria
-
 Cambodia
-
 Cameroon
-
 Canada
-
 Chile
Chile
-
 China
China
-
 Colombia
-
 Congo
Congo
-
 Costa Rica
-
 Cote d'Ivoire
-
 Croatia
-
 Cuba
Cuba
-
 Cyprus
-
 Czechia
-
 DR Congo
-
 Denmark
-
 Dominican Republic
-
 Ecuador
-
 Egypt
Egypt
-
 El Salvador
-
 Estonia
-
 Eswatini
-
 Ethiopia
-
 Finland
-
 France
-
 Georgia
-
 Germany
-
 Ghana
Ghana
-
 Greece
-
 Haiti
Haiti
-
 Hong Kong
-
 Hungary
-
 India
India
-
 Indonesia
-
 Iran, Islamic republic
-
 Iraq
Iraq
-
 Ireland
-
 Israel
-
 Italy
Italy
-
 Jamaica
-
 Japan
Japan
-
 Jordan
-
 Kazakhstan
-
 Kenya
Kenya
-
 Korea
Korea
-
 Kuwait
-
 Kyrgyzstan
-
 Laos
Laos
-
 Latvia
-
 Lebanon
-
 Lesotho
-
 Libya
Libya
-
 Lithuania
-
 Luxembourg
-
 Madagascar
-
 Malaysia
-
 Malta
Malta
-
 Mauritius
-
 Mexico
-
 Moldova
-
 Mongolia
-
 Montenegro
-
 Morocco
-
 Mozambique
-
 Myanmar
-
 Namibia
-
 Nepal
Nepal
-
 Netherlands
-
 New Zealand
-
 Nigeria
-
 North Macedonia
-
 Norway
-
 Oman
Oman
-
 Pakistan
-
 Palestine
-
 Panama
-
 Papua New Guinea
-
 Paraguay
-
 Peru
Peru
-
 Philippines
-
 Poland
-
 Portugal
-
 Puerto Rico
-
 Qatar
Qatar
-
 Reunion
-
 Romania
-
 Rwanda
-
 Saudi Arabia
-
 Serbia
-
 Singapore
-
 Slovakia
-
 Slovenia
-
 Somalia
-
 South Africa
-
 Spain
Spain
-
 Sri Lanka
-
 Sweden
-
 Switzerland
-
 Syria
Syria
-
 Taiwan
-
 Tajikistan
-
 Tanzania
-
 Thailand
-
 Trinidad and Tobago
-
 Tunisia
-
 Turkey
-
 UAE
UAE
-
 Uganda
-
 Ukraine
-
 United Kingdom
-
United States
-
 Uruguay
-
 Uzbekistan
-
 Venezuela
-
 Vietnam
-
 Yemen
Yemen
-
 Zambia
-
 Zimbabwe
- Forex
- Crypto
