
Polkadot gains 21.78% as bullish momentum tests $1.644 resistance and MA-50 barrier – weekly outlook

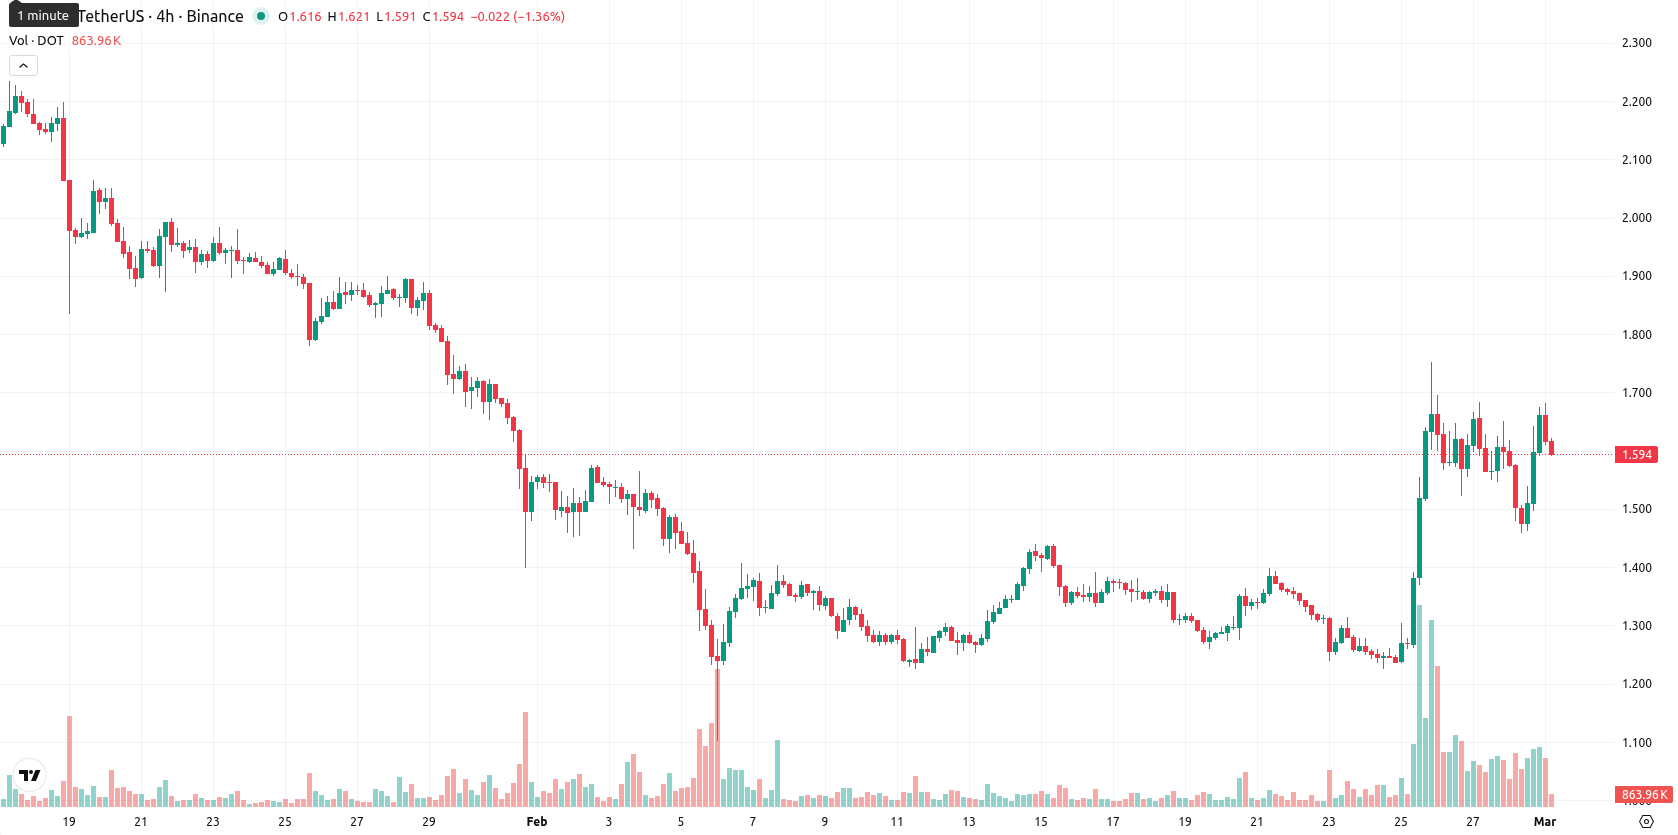
Polkadot (DOT) is trading at $1.60, positioned above the MA-20 ($1.381) and just below its MA-50 ($1.644), but remains well under the long-term MA-200 ($2.723). Over the past week, the price advanced by $0.059, marking a 3.83% gain, highlighting short- and medium-term bullish momentum while long-term resistance continues to cap further upside.
Highlights
- DOT is trading at $1.60, above the MA-20 ($1.381) and just below the MA-50 ($1.644), reflecting recent short- and medium-term bullish momentum.
- Momentum indicators are mixed, with ADX showing bullish strength but Stochastic RSI and Commodity Channel Index both overbought, indicating rising risk of a short-term pullback.
- The price is expected to consolidate in a $1.45–$1.75 range this week, with a less than 20% probability of further upside and increased risk of downward movement below $1.45.
Halving anticipation and ETF speculation drive weekly sentiment and inflows
Anticipation for Polkadot's upcoming halving event, scheduled for March 14, 2026, has driven renewed interest as it will reduce the annual token issuance by more than 50% and transition the network toward a deflationary model. Additionally, speculation around possible Polkadot-based ETFs from institutional players like Grayscale and 21Shares has contributed to heightened market excitement and fresh inflows. These developments have reinforced Polkadot’s standing among leading altcoins in recent days.
Bullish weekly signals tempered by overbought risks and neutral MACD
On the weekly chart, DOT is consolidating above the MA-20 but struggling just below the MA-50, while long-term resistance from the MA-200 at $2.723 persists. The closest weekly support lies around the Ichimoku Kijun at $1.426, with resistance at $1.644 and $1.75. Weekly RSI signals continued buying momentum, though overbought oscillators and a neutral MACD caution that upside potential may be easing.
Range-bound outlook as overbought conditions limit upside for next week
For the week ahead, DOT is likely to trade within a range of $1.45 to $1.75, with the probability of a sustained advance now low. Most indicators favor consolidation or a mild pullback, as overbought conditions on weekly oscillators outweigh momentum. A break above $1.70 could open the door to further resistance tests, while a move below $1.45 would indicate increased downside risk.
Previously it was reported that Polkadot is trading above its short-term moving average but remains below medium- and long-term averages, reflecting ongoing selling pressure despite near-term support. Technical indicators present conflicting signals—MACD shows strong sell, RSI is slightly bullish, but overbought oscillators and persistent downside volatility constrain upside, with key support at $1.426 and resistance near $1.65.


Latest Polkadot News


-
 Afghanistan
-
 Albania
-
 Algeria
-
 Angola
-
 Argentina
-
 Armenia
-
 Australia
-
 Austria
-
 Azerbaijan
-
 Bahamas
-
 Bahrain
-
 Bangladesh
-
 Belarus
-
 Belgium
-
 Bolivia
-
 Botswana
-
 Brazil
-
 Brunei
-
 Bulgaria
-
 Cambodia
-
 Cameroon
-
 Canada
-
 Chile
Chile
-
 China
China
-
 Colombia
-
 Congo
Congo
-
 Costa Rica
-
 Cote d'Ivoire
-
 Croatia
-
 Cuba
Cuba
-
 Cyprus
-
 Czechia
-
 DR Congo
-
 Denmark
-
 Dominican Republic
-
 Ecuador
-
 Egypt
Egypt
-
 El Salvador
-
 Estonia
-
 Eswatini
-
 Ethiopia
-
 Finland
-
 France
-
 Georgia
-
 Germany
-
 Ghana
Ghana
-
 Greece
-
 Haiti
Haiti
-
 Hong Kong
-
 Hungary
-
 India
India
-
 Indonesia
-
 Iran, Islamic republic
-
 Iraq
Iraq
-
 Ireland
-
 Israel
-
 Italy
Italy
-
 Jamaica
-
 Japan
Japan
-
 Jordan
-
 Kazakhstan
-
 Kenya
Kenya
-
 Korea
Korea
-
 Kuwait
-
 Kyrgyzstan
-
 Laos
Laos
-
 Latvia
-
 Lebanon
-
 Lesotho
-
 Libya
Libya
-
 Lithuania
-
 Luxembourg
-
 Madagascar
-
 Malaysia
-
 Malta
Malta
-
 Mauritius
-
 Mexico
-
 Moldova
-
 Mongolia
-
 Montenegro
-
 Morocco
-
 Mozambique
-
 Myanmar
-
 Namibia
-
 Nepal
Nepal
-
 Netherlands
-
 New Zealand
-
 Nigeria
-
 North Macedonia
-
 Norway
-
 Oman
Oman
-
 Pakistan
-
 Palestine
-
 Panama
-
 Papua New Guinea
-
 Paraguay
-
 Peru
Peru
-
 Philippines
-
 Poland
-
 Portugal
-
 Puerto Rico
-
 Qatar
Qatar
-
 Reunion
-
 Romania
-
 Rwanda
-
 Saudi Arabia
-
 Serbia
-
 Singapore
-
 Slovakia
-
 Slovenia
-
 Somalia
-
 South Africa
-
 Spain
Spain
-
 Sri Lanka
-
 Sweden
-
 Switzerland
-
 Syria
Syria
-
 Taiwan
-
 Tajikistan
-
 Tanzania
-
 Thailand
-
 Trinidad and Tobago
-
 Tunisia
-
 Turkey
-
 UAE
UAE
-
 Uganda
-
 Ukraine
-
 United Kingdom
-
United States
-
 Uruguay
-
 Uzbekistan
-
 Venezuela
-
 Vietnam
-
 Yemen
Yemen
-
 Zambia
-
 Zimbabwe
- Forex
- Crypto
