
-4.21% for Solana — ETF inflows add to regulatory uncertainty

Solana (SOL) is trading at $83.05, down 4.21% for the day. The current price remains slightly below the MA-20 ($83.40), MA-50 ($104.78), and well under the MA-200 at $156.87, confirming ongoing pressure from sellers across all timeframes.
SOL price prediction
Current price:
$ 71.09
2.27
3.30%
Real-time Data
13:41
Daily range
69.48
 72.3
72.3
Weekly range
66.94
76.09
Loading...
Highlights
- Solana faces heightened regulatory risk from a class action lawsuit linked to Pump.fun, driving increased volatility and investor caution around its legal status.
- Retail capital is exiting Solana while institutional Solana ETF inflows create uncertainty over regulatory compliance and future market participation compared to competitors.
- Solana trades at $83.05, below its MA-20 ($83.40), MA-50 ($104.78), and MA-200 ($156.87), with sustained bearish momentum and a projected $78.00–$87.00 range for next week.
Institutional inflows and legal risks increase market volatility for Solana
Solana is currently facing significant regulatory risks, including a class action lawsuit linked to activities on Pump.fun, which has contributed to increased market volatility and investor caution regarding its legal status. A marked exodus of retail capital has been reported, while strong institutional inflows to Solana-focused ETFs have introduced further uncertainty about future market participation and regulatory compliance relative to competitors. Additionally, regulatory pressures may increase as persistent inflationary conditions and concerns around global macro stability prompt greater scrutiny of major cryptocurrencies. These factors have accompanied the recent period of downward price pressure.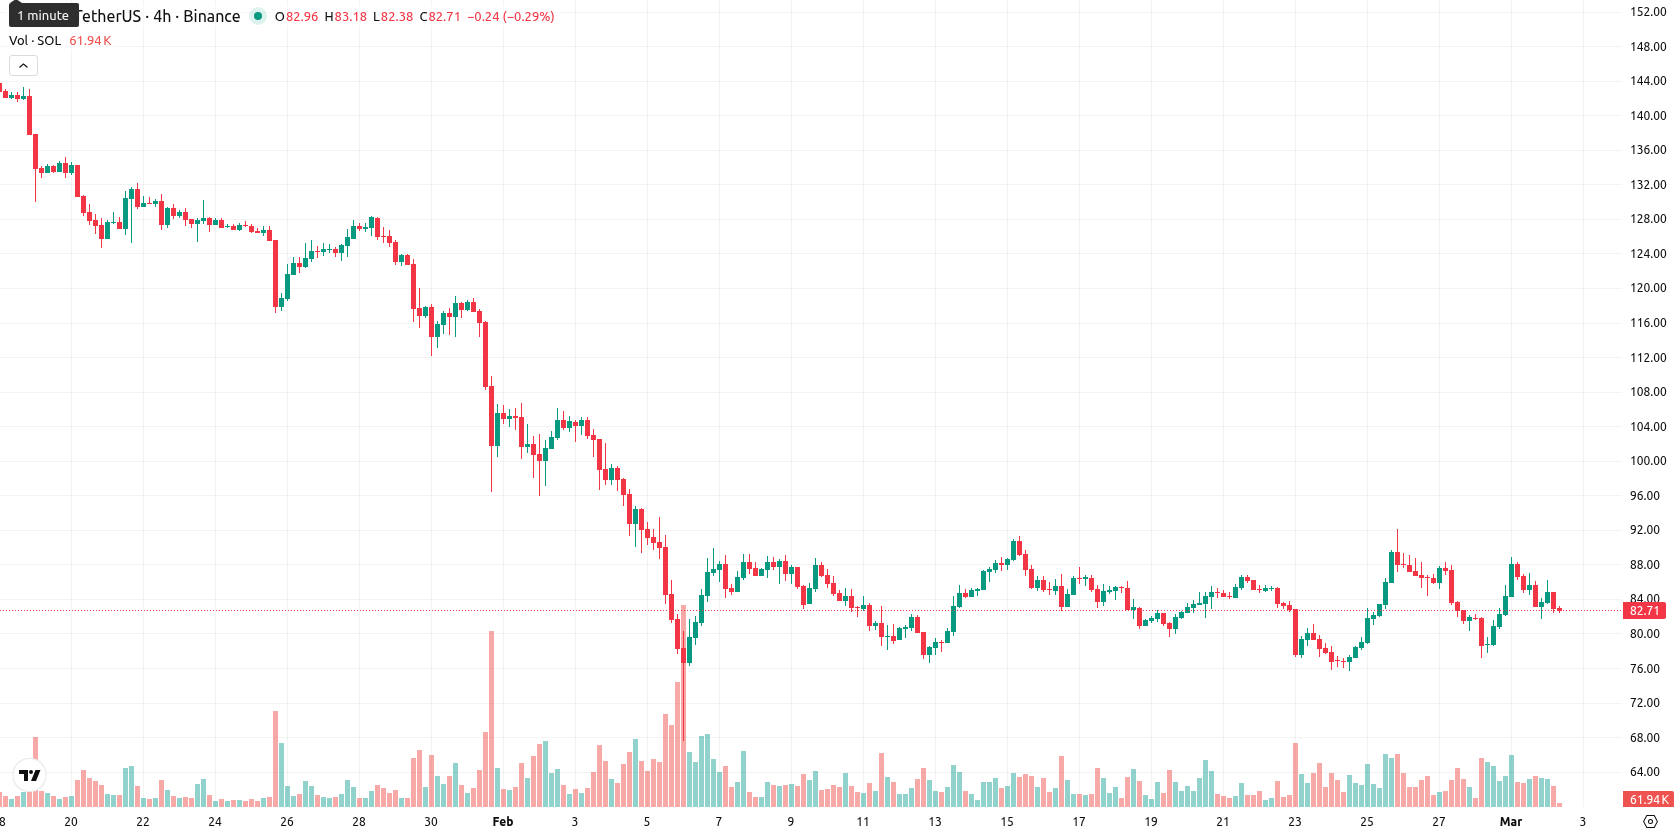
Persistent bearish momentum as primary indicators confirm negative trend
Momentum indicators remain notably bearish: the daily MACD gives a strong sell, and the ADX on D1 is elevated, reinforcing the strength of the downward move. The RSI on D1, at 42.65, is deep in sell territory, accompanied by a strong sell from the Stochastic RSI, while the Commodity Channel Index is neutral. Bull/Bear Power indicates an overbought reading with persistent seller dominance, aligned with negative daily movement and moderate to high volatility. Solana closed the session near its low of $82.46, with no signs of intraday recovery, as all primary momentum signals continue to point to the downside and no material divergence is detected.Further downside favored as sell signals persist across technicals
In the near term, Solana is expected to oscillate within a volatility band of $78.00 to $87.00 relative to current levels. Persistent sell signals across weekly and daily moving averages, MACD, ADX, and RSI indicate a low probability — less than 20% — of upward movement, making further declines more likely. The baseline scenario is for price to consolidate sideways within this corridor. A move above the immediate resistance at the Ichimoku Kijun ($83.59) could target the upper end of the range, while a drop below $78.00 may lead to further downside acceleration.
Viktoras Karapetjanc, expert at Traders Union, sees Solana facing strong headwinds from persistent regulatory risks and recent retail capital outflows. He believes that while institutional ETF inflows add support, ongoing macro and legal pressures are keeping sentiment muted. The analyst notes that bearish momentum and negative news flow make near-term upside unlikely. "If Solana can defend $78.00 and regulatory clarity improves, I expect bulls to gradually regain confidence, but for now, consolidation remains the likely scenario."
Previously it was reported that Solana is trading just above short-term support amid a daily decline, while remaining under strong downward pressure from medium- and long-term moving averages and persistent sell signals from momentum indicators such as the MACD, RSI, and ADX. Technical readings suggest continued sideways trading within a defined range, with a higher likelihood of further declines if selling pressure persists.
Source of Data:
SOL Price Analysis by TU
The analysis is based on a proprietary model combining technical, on-chain, and expert data. Not investment advice. See
methodology
This material may contain third-party opinions, none of the data and information on this webpage constitutes investment advice according to our Disclaimer. While we adhere to strict Editorial Integrity, this post may contain references to products from our partners.
Subscribe to TU news

Did you like the article?


Latest Solana News


Weekly Top Bonuses

Top News


Top 5 companies for you

United States
-
 Afghanistan
-
 Albania
-
 Algeria
-
 Angola
-
 Argentina
-
 Armenia
-
 Australia
-
 Austria
-
 Azerbaijan
-
 Bahamas
-
 Bahrain
-
 Bangladesh
-
 Belarus
-
 Belgium
-
 Bolivia
-
 Botswana
-
 Brazil
-
 Brunei
-
 Bulgaria
-
 Cambodia
-
 Cameroon
-
 Canada
-
 Chile
Chile
-
 China
China
-
 Colombia
-
 Congo
Congo
-
 Costa Rica
-
 Cote d'Ivoire
-
 Croatia
-
 Cuba
Cuba
-
 Cyprus
-
 Czechia
-
 DR Congo
-
 Denmark
-
 Dominican Republic
-
 Ecuador
-
 Egypt
Egypt
-
 El Salvador
-
 Estonia
-
 Eswatini
-
 Ethiopia
-
 Finland
-
 France
-
 Georgia
-
 Germany
-
 Ghana
Ghana
-
 Greece
-
 Haiti
Haiti
-
 Hong Kong
-
 Hungary
-
 India
India
-
 Indonesia
-
 Iran, Islamic republic
-
 Iraq
Iraq
-
 Ireland
-
 Israel
-
 Italy
Italy
-
 Jamaica
-
 Japan
Japan
-
 Jordan
-
 Kazakhstan
-
 Kenya
Kenya
-
 Korea
Korea
-
 Kuwait
-
 Kyrgyzstan
-
 Laos
Laos
-
 Latvia
-
 Lebanon
-
 Lesotho
-
 Libya
Libya
-
 Lithuania
-
 Luxembourg
-
 Madagascar
-
 Malaysia
-
 Malta
Malta
-
 Mauritius
-
 Mexico
-
 Moldova
-
 Mongolia
-
 Montenegro
-
 Morocco
-
 Mozambique
-
 Myanmar
-
 Namibia
-
 Nepal
Nepal
-
 Netherlands
-
 New Zealand
-
 Nigeria
-
 North Macedonia
-
 Norway
-
 Oman
Oman
-
 Pakistan
-
 Palestine
-
 Panama
-
 Papua New Guinea
-
 Paraguay
-
 Peru
Peru
-
 Philippines
-
 Poland
-
 Portugal
-
 Puerto Rico
-
 Qatar
Qatar
-
 Reunion
-
 Romania
-
 Rwanda
-
 Saudi Arabia
-
 Serbia
-
 Singapore
-
 Slovakia
-
 Slovenia
-
 Somalia
-
 South Africa
-
 Spain
Spain
-
 Sri Lanka
-
 Sweden
-
 Switzerland
-
 Syria
Syria
-
 Taiwan
-
 Tajikistan
-
 Tanzania
-
 Thailand
-
 Trinidad and Tobago
-
 Tunisia
-
 Turkey
-
 UAE
UAE
-
 Uganda
-
 Ukraine
-
 United Kingdom
-
United States
-
 Uruguay
-
 Uzbekistan
-
 Venezuela
-
 Vietnam
-
 Yemen
Yemen
-
 Zambia
-
 Zimbabwe
- Forex
- Crypto
Live News
