
Solana price prediction: Will address growth and ETF inflows drive further gains? SOL up 1.91%

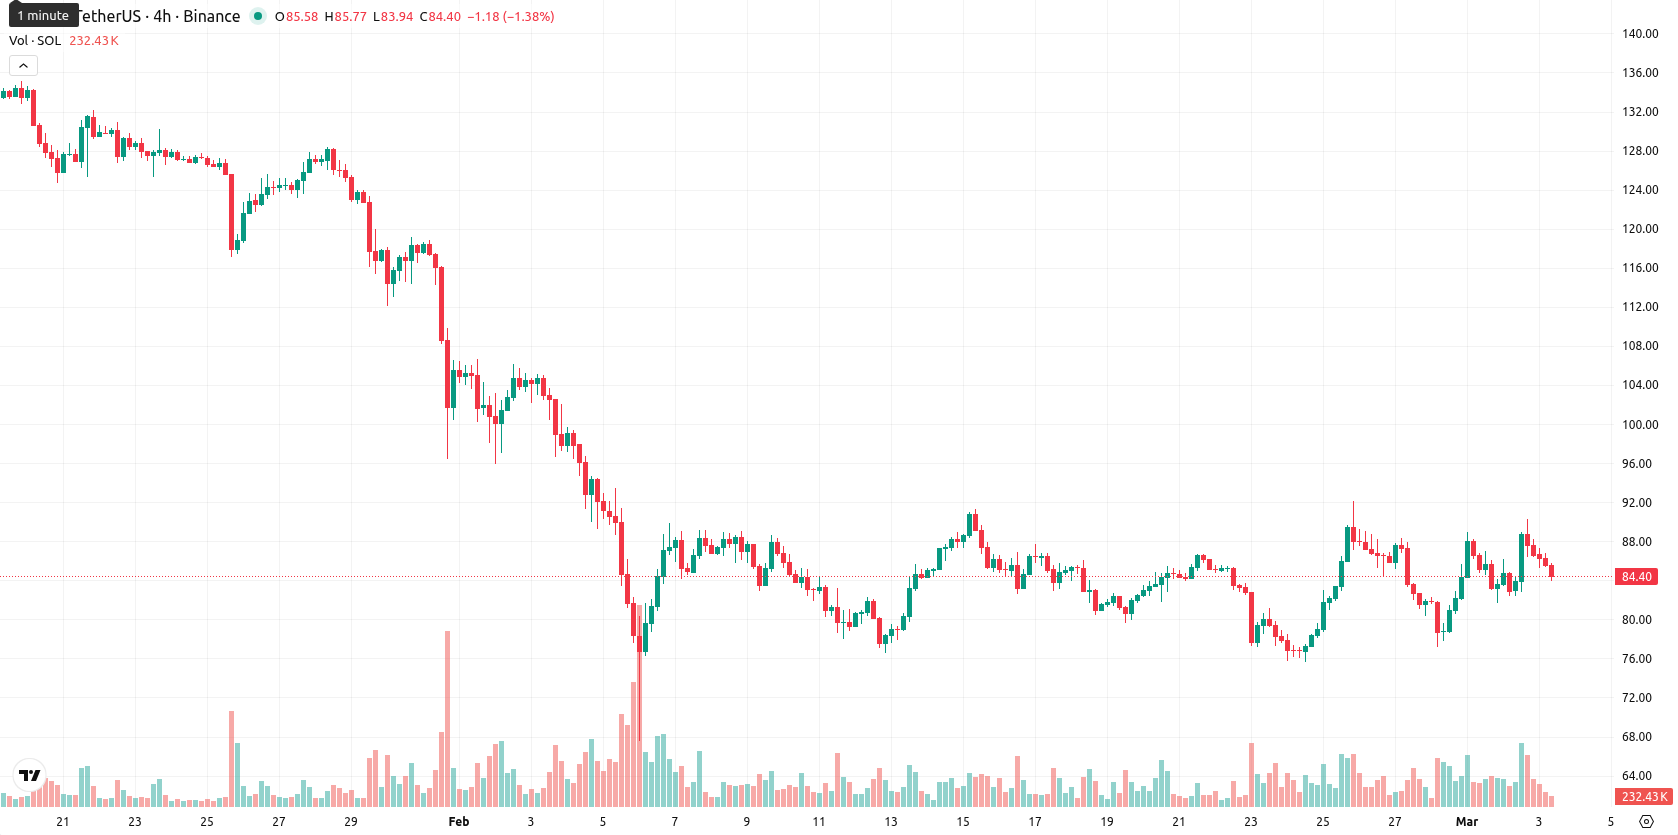
Solana (SOL) is trading at $85.78, up 1.91% today. The price sits above its MA-20 at $83.61 but remains well below the MA-50 at $103.73 and MA-200 at $156.35, indicating short-term bullish momentum within broader medium- and long-term selling pressure.
Highlights
- Solana saw roughly $61 million in spot inflows and ETF holdings reached $781.45 million in early March 2026, underscoring strong institutional interest.
- Ecosystem adoption remains robust, with new daily Solana addresses rising by 1.4 million to 8.6 million in 12 days and stablecoin market cap at $15.4 billion.
- Solana trades at $85.78, above its MA-20 ($83.61) with immediate support at $80.47 and resistance between $87.25 and $90.00, indicating a sideways short-term trend.
Spot inflows and ecosystem growth as ETF holdings rise
Solana experienced significant inflows into spot assets and ETFs in early March 2026, with buyers accumulating approximately $61 million in SOL across major sessions and ETF holdings reaching nearly $781.45 million. Ecosystem metrics continue to show robust growth, as new daily Solana addresses rose by 1.4 million over 12 days to 8.6 million and the stablecoin market cap expanded to $15.4 billion. The upcoming $BANK poker bankroll SPL token presale is scheduled to launch on the platform via Metaplex Spotlight, highlighting ongoing project activity.
Mixed momentum signals as consolidation persists near key technical levels
The Ichimoku Kijun level on the daily chart is at $80.47, providing immediate support, while the price holds above the MA-20 but remains below the MA-50 and MA-200, reinforcing a short-term bullish tone within a broader downtrend. Resistance is seen near $87.25 – $90.00, and support is marked at $80.47 – $83.61. Momentum indicators are mixed: MACD and ADX both point to ongoing bearish momentum, while the CCI signals a mild buy, RSI sits weak at 47.20, and the Stochastic RSI is overbought, hinting at a possible near-term reversal. Bull/Bear Power shows intraday buyer dominance, but the blend of these indicators suggests a continued period of sideways consolidation.
Sideways trading likely as rallies face resistance amid seller bias
Over the next five sessions, typical volatility suggests SOL will trade in a normalized price band between $81.00 and $90.00. A sustained move above $90.00 could trigger a short-term bullish move, targeting higher resistance, while a drop below $81.00 may lead to increased selling towards lower support levels. The likely baseline is for price action to remain in a sideways corridor defined by the current support and resistance bands. With medium- and long-term signals favoring sellers, upward rallies are likely to face strong resistance.
Previously it was reported that Solana remains under persistent bearish momentum, trading below key short-, medium-, and long-term moving averages, with all major technical indicators such as the MACD, RSI, and ADX signaling continued downward pressure and volatility. The price is expected to consolidate within a broad range, with further downside favored unless it decisively breaks above immediate resistance, reflecting ongoing regulatory risks and institutional-retail capital shifts.


Latest Solana News


-
 Afghanistan
-
 Albania
-
 Algeria
-
 Angola
-
 Argentina
-
 Armenia
-
 Australia
-
 Austria
-
 Azerbaijan
-
 Bahamas
-
 Bahrain
-
 Bangladesh
-
 Belarus
-
 Belgium
-
 Bolivia
-
 Botswana
-
 Brazil
-
 Brunei
-
 Bulgaria
-
 Cambodia
-
 Cameroon
-
 Canada
-
 Chile
Chile
-
 China
China
-
 Colombia
-
 Congo
Congo
-
 Costa Rica
-
 Cote d'Ivoire
-
 Croatia
-
 Cuba
Cuba
-
 Cyprus
-
 Czechia
-
 DR Congo
-
 Denmark
-
 Dominican Republic
-
 Ecuador
-
 Egypt
Egypt
-
 El Salvador
-
 Estonia
-
 Eswatini
-
 Ethiopia
-
 Finland
-
 France
-
 Georgia
-
 Germany
-
 Ghana
Ghana
-
 Greece
-
 Haiti
Haiti
-
 Hong Kong
-
 Hungary
-
 India
India
-
 Indonesia
-
 Iran, Islamic republic
-
 Iraq
Iraq
-
 Ireland
-
 Israel
-
 Italy
Italy
-
 Jamaica
-
 Japan
Japan
-
 Jordan
-
 Kazakhstan
-
 Kenya
Kenya
-
 Korea
Korea
-
 Kuwait
-
 Kyrgyzstan
-
 Laos
Laos
-
 Latvia
-
 Lebanon
-
 Lesotho
-
 Libya
Libya
-
 Lithuania
-
 Luxembourg
-
 Madagascar
-
 Malaysia
-
 Malta
Malta
-
 Mauritius
-
 Mexico
-
 Moldova
-
 Mongolia
-
 Montenegro
-
 Morocco
-
 Mozambique
-
 Myanmar
-
 Namibia
-
 Nepal
Nepal
-
 Netherlands
-
 New Zealand
-
 Nigeria
-
 North Macedonia
-
 Norway
-
 Oman
Oman
-
 Pakistan
-
 Palestine
-
 Panama
-
 Papua New Guinea
-
 Paraguay
-
 Peru
Peru
-
 Philippines
-
 Poland
-
 Portugal
-
 Puerto Rico
-
 Qatar
Qatar
-
 Reunion
-
 Romania
-
 Rwanda
-
 Saudi Arabia
-
 Serbia
-
 Singapore
-
 Slovakia
-
 Slovenia
-
 Somalia
-
 South Africa
-
 Spain
Spain
-
 Sri Lanka
-
 Sweden
-
 Switzerland
-
 Syria
Syria
-
 Taiwan
-
 Tajikistan
-
 Tanzania
-
 Thailand
-
 Trinidad and Tobago
-
 Tunisia
-
 Turkey
-
 UAE
UAE
-
 Uganda
-
 Ukraine
-
 United Kingdom
-
United States
-
 Uruguay
-
 Uzbekistan
-
 Venezuela
-
 Vietnam
-
 Yemen
Yemen
-
 Zambia
-
 Zimbabwe
- Forex
- Crypto
