
Solana price prediction: Will strong inflows offset resistance? SOL surges 6.06%

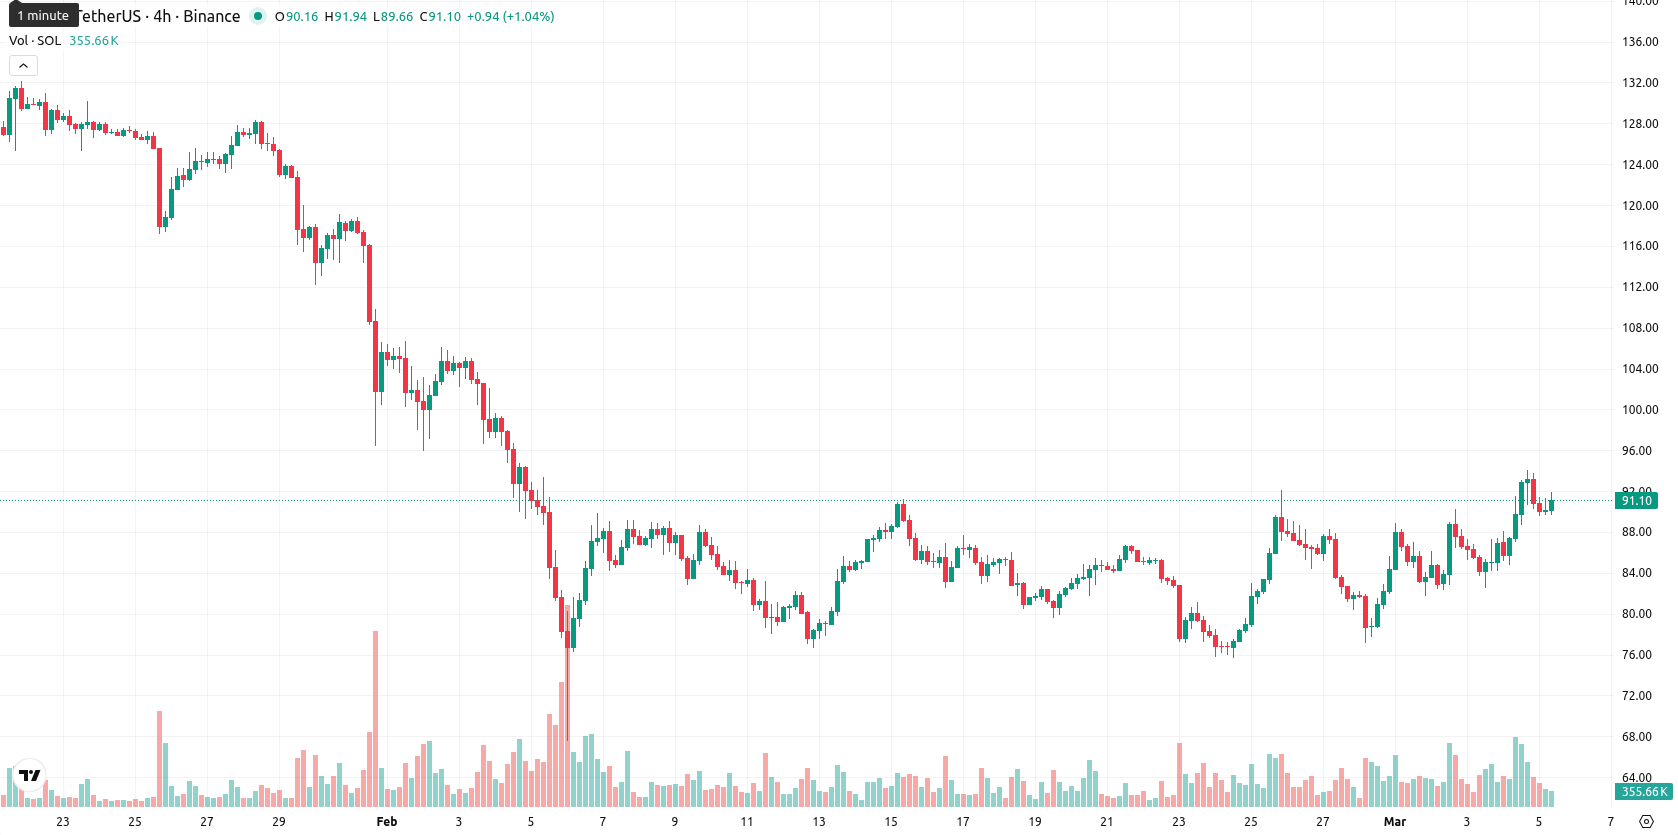
Solana (SOL) is trading at $90.37, above its MA-20 ($84.59) but below the MA-50 ($101.58) and MA-200 ($155.36). This setup signals short-term bullish momentum, while medium- and long-term trends remain pressured by sellers.
Highlights
- Solana's network reached a record $650 billion stablecoin transaction volume last month, spurring increased institutional demand.
- Spot Solana ETFs pulled in $63 million net inflows since October, while new partnerships expanded on-chain IPO and fiat on-ramp services.
- SOL trades with short-term bullish momentum but remains below key resistance, with a likely price range of $82–$97 and higher downside risk this week.
Institutional inflows rise as stablecoin volume and whale activity surge
Solana's network saw stablecoin transaction volumes hit a record $650 billion last month, drawing increased attention from institutional investors. Spot Solana ETFs have attracted $63 million in net inflows since October, including $18.44 million over the past two sessions. Recent developments include rising on-chain activity, significant whale accumulation near the $92–$95 resistance area, and the launch of an on-chain IPO service by Backpack in partnership with Superstate. Additionally, Crossmint and Western Union have partnered to make stablecoin access and real-world cash conversions more accessible on Solana's network.
Overbought signals emerge as buyers test resistance amid mixed momentum
Momentum signals are mixed on the daily chart: the MACD issues a strong sell, and the ADX shows persistent but weakening bearish strength. The RSI is neutral to positive at 52, while Stochastic RSI and CCI both indicate overbought conditions, pointing to a rally that may be stretched. Bull/Bear Power is in overbought territory, signaling dominant buyer activity today, whereas the Awesome Oscillator is neutral and does not confirm trend support. SOL gained $5.16 (up 6.06%) since the previous close, opened higher, and now trades near the day's range high ($89.64 – $91.38), reflecting robust intraday volatility and buyer strength; however, overbought signals versus strong momentum suggest caution as near-term resistance approaches.
Downside risk elevated as broad trend constrains near-term rally
Over the next five trading days, SOL is likely to fluctuate within a $82 – $97 volatility band relative to current levels. The statistical probability of further upside is considered low (less than 20%), while downside potential is more pronounced due to persistent medium- and long-term sell pressure. Price stabilization within this range is the base case scenario. A sustained rally would require a clear breakout above $97, while a drop below $82 could trigger a bearish move.
Previously it was reported that Solana is displaying short-term bullish momentum, trading above its 20-day moving average but remaining constrained below the 50- and 200-day averages, as inflows and ecosystem growth support modest gains. However, mixed momentum signals and resistance near $87.25–$90.00 indicate that price action is likely to consolidate sideways within defined support and resistance, with broader trends still favoring selling pressure.


Latest Solana News


-
 Afghanistan
-
 Albania
-
 Algeria
-
 Angola
-
 Argentina
-
 Armenia
-
 Australia
-
 Austria
-
 Azerbaijan
-
 Bahamas
-
 Bahrain
-
 Bangladesh
-
 Belarus
-
 Belgium
-
 Bolivia
-
 Botswana
-
 Brazil
-
 Brunei
-
 Bulgaria
-
 Cambodia
-
 Cameroon
-
 Canada
-
 Chile
Chile
-
 China
China
-
 Colombia
-
 Congo
Congo
-
 Costa Rica
-
 Cote d'Ivoire
-
 Croatia
-
 Cuba
Cuba
-
 Cyprus
-
 Czechia
-
 DR Congo
-
 Denmark
-
 Dominican Republic
-
 Ecuador
-
 Egypt
Egypt
-
 El Salvador
-
 Estonia
-
 Eswatini
-
 Ethiopia
-
 Finland
-
 France
-
 Georgia
-
 Germany
-
 Ghana
Ghana
-
 Greece
-
 Haiti
Haiti
-
 Hong Kong
-
 Hungary
-
 India
India
-
 Indonesia
-
 Iran, Islamic republic
-
 Iraq
Iraq
-
 Ireland
-
 Israel
-
 Italy
Italy
-
 Jamaica
-
 Japan
Japan
-
 Jordan
-
 Kazakhstan
-
 Kenya
Kenya
-
 Korea
Korea
-
 Kuwait
-
 Kyrgyzstan
-
 Laos
Laos
-
 Latvia
-
 Lebanon
-
 Lesotho
-
 Libya
Libya
-
 Lithuania
-
 Luxembourg
-
 Madagascar
-
 Malaysia
-
 Malta
Malta
-
 Mauritius
-
 Mexico
-
 Moldova
-
 Mongolia
-
 Montenegro
-
 Morocco
-
 Mozambique
-
 Myanmar
-
 Namibia
-
 Nepal
Nepal
-
 Netherlands
-
 New Zealand
-
 Nigeria
-
 North Macedonia
-
 Norway
-
 Oman
Oman
-
 Pakistan
-
 Palestine
-
 Panama
-
 Papua New Guinea
-
 Paraguay
-
 Peru
Peru
-
 Philippines
-
 Poland
-
 Portugal
-
 Puerto Rico
-
 Qatar
Qatar
-
 Reunion
-
 Romania
-
 Rwanda
-
 Saudi Arabia
-
 Serbia
-
 Singapore
-
 Slovakia
-
 Slovenia
-
 Somalia
-
 South Africa
-
 Spain
Spain
-
 Sri Lanka
-
 Sweden
-
 Switzerland
-
 Syria
Syria
-
 Taiwan
-
 Tajikistan
-
 Tanzania
-
 Thailand
-
 Trinidad and Tobago
-
 Tunisia
-
 Turkey
-
 UAE
UAE
-
 Uganda
-
 Ukraine
-
 United Kingdom
-
United States
-
 Uruguay
-
 Uzbekistan
-
 Venezuela
-
 Vietnam
-
 Yemen
Yemen
-
 Zambia
-
 Zimbabwe
- Forex
- Crypto
