

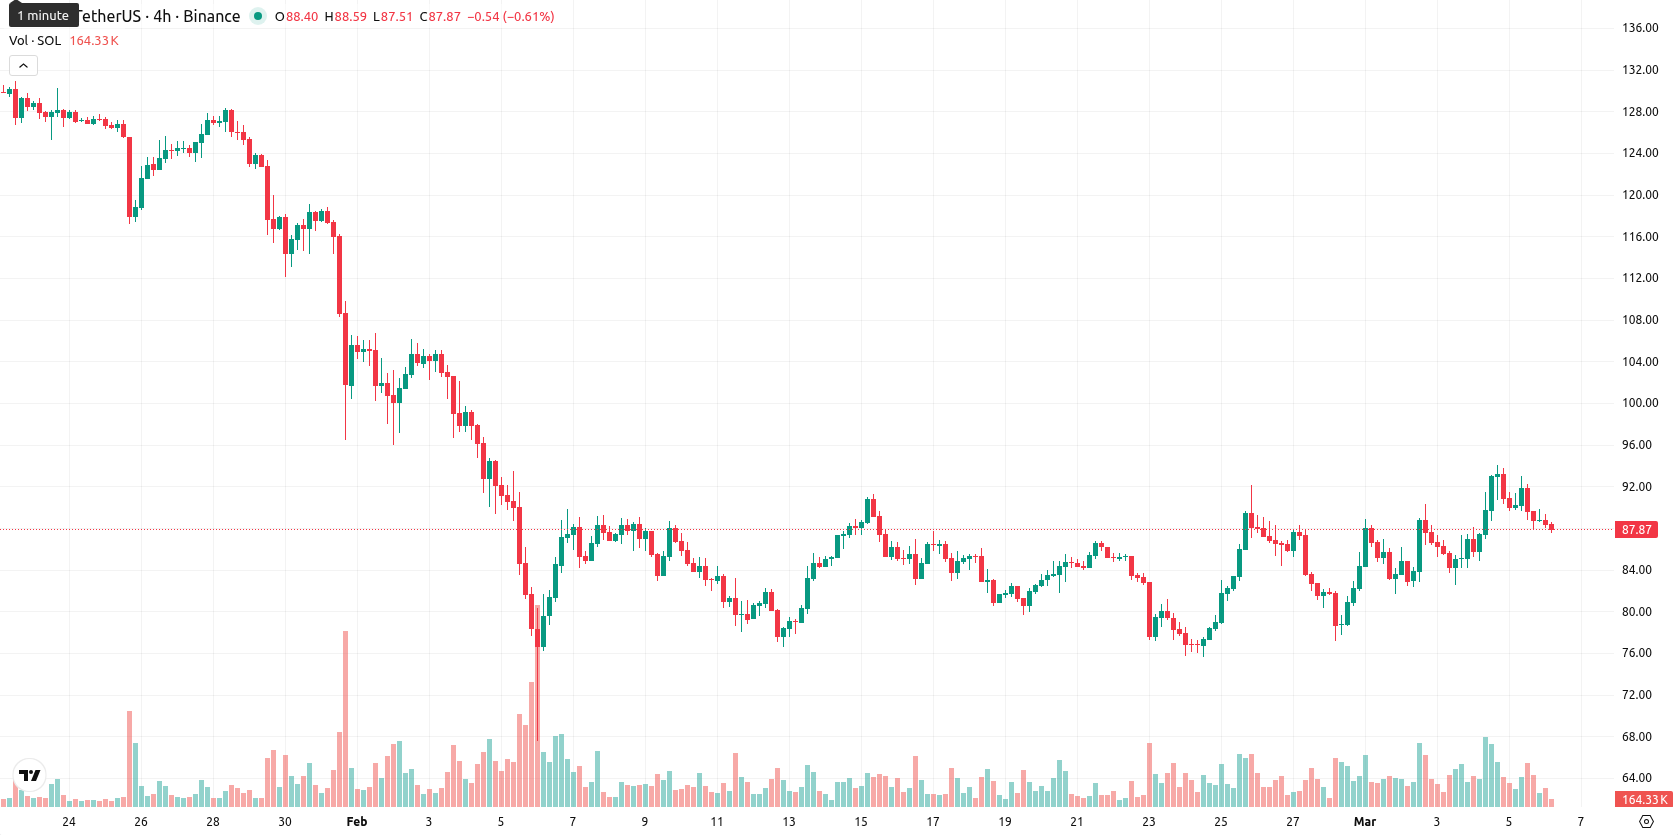
Solana (SOL) is currently trading at $87.88 after a daily decline of 2.44%. The asset is positioned above its MA-20 ($84.84), but remains below the MA-50 ($100.43) and well under the MA-200 ($154.85), indicating short-term bullish momentum within a broader medium- to long-term bearish structure.
Highlights
- Solana's investment outlook remains clouded by SEC scrutiny, with unregistered security risks limiting institutional participation and U.S. market access.
- Heightened geopolitical tensions and inflation fears have increased volatility in the crypto sector, constraining capital flows into riskier assets like Solana.
- Technical indicators signal a predominantly bearish bias, with Solana likely to trade between $83.00 and $92.50 and a high probability of continued range-bound or declining prices.
Liquidity risks grow as SEC scrutiny and global tension unsettle flows
Solana faces significant regulatory risk due to the SEC's prior classification of SOL as a potential unregistered security. This has restricted institutional investment and raised the possibility of enforcement actions, limitations on exchange support, or potential delisting from U.S. markets, impacting asset liquidity and accessibility. Additionally, global conflicts and associated inflation concerns have recently contributed to heightened volatility across cryptocurrency markets and affected capital flows into high-risk assets such as Solana. Regulatory uncertainty continues to overshadow market sentiment.
Bearish momentum persists despite overbought signals and intraday volatility
The technical setup shows Solana supported immediately by the Ichimoku Kijun at $84.84, yet it is constrained by the MA-50 and remains well below the MA-200, confirming a bearish medium- to long-term outlook. Among momentum indicators, the MACD issues a strong sell signal and the ADX confirms a pronounced downtrend, while the RSI is close to neutral but slightly bearish. Stochastic RSI and CCI both indicate overbought conditions implying risk of a corrective pullback, while Bull/Bear Power also points to overbought levels, suggesting buyer dominance may be waning. The Awesome Oscillator stands out with a strong buy reading, although this contradicts the broader bearish momentum; recent daily price action shows moderate intraday volatility and closes near the session low, underscoring ongoing downside pressure.
Downside favored as technicals fail to signal bullish reversal
Over the next week, Solana is expected to trade within a volatility band relative to current levels, ranging from $83.00 to $92.50. Given the absence of buy signals across weekly technical indicators, the probability of a near-term price increase is below 20%, making a downward move more likely. The baseline scenario is for price action to remain confined between immediate support and resistance. If buyers manage to lift SOL above $92.50, a short-term bullish reversal could occur, while a close below $83.00 would indicate renewed selling pressure and raise the risk of further declines.
Previously it was reported that Solana is exhibiting short-term bullish momentum, trading above its 20-day moving average, though it remains under pressure from sellers as it sits below its 50- and 200-day averages. Despite strong institutional inflows and surging on-chain activity, mixed momentum indicators and overbought conditions suggest near-term upside is limited, with resistance near $97 and elevated downside risk.


Latest Solana News


-
 Afghanistan
-
 Albania
-
 Algeria
-
 Angola
-
 Argentina
-
 Armenia
-
 Australia
-
 Austria
-
 Azerbaijan
-
 Bahamas
-
 Bahrain
-
 Bangladesh
-
 Belarus
-
 Belgium
-
 Bolivia
-
 Botswana
-
 Brazil
-
 Brunei
-
 Bulgaria
-
 Cambodia
-
 Cameroon
-
 Canada
-
 Chile
Chile
-
 China
China
-
 Colombia
-
 Congo
Congo
-
 Costa Rica
-
 Cote d'Ivoire
-
 Croatia
-
 Cuba
Cuba
-
 Cyprus
-
 Czechia
-
 DR Congo
-
 Denmark
-
 Dominican Republic
-
 Ecuador
-
 Egypt
Egypt
-
 El Salvador
-
 Estonia
-
 Eswatini
-
 Ethiopia
-
 Finland
-
 France
-
 Georgia
-
 Germany
-
 Ghana
Ghana
-
 Greece
-
 Haiti
Haiti
-
 Hong Kong
-
 Hungary
-
 India
India
-
 Indonesia
-
 Iran, Islamic republic
-
 Iraq
Iraq
-
 Ireland
-
 Israel
-
 Italy
Italy
-
 Jamaica
-
 Japan
Japan
-
 Jordan
-
 Kazakhstan
-
 Kenya
Kenya
-
 Korea
Korea
-
 Kuwait
-
 Kyrgyzstan
-
 Laos
Laos
-
 Latvia
-
 Lebanon
-
 Lesotho
-
 Libya
Libya
-
 Lithuania
-
 Luxembourg
-
 Madagascar
-
 Malaysia
-
 Malta
Malta
-
 Mauritius
-
 Mexico
-
 Moldova
-
 Mongolia
-
 Montenegro
-
 Morocco
-
 Mozambique
-
 Myanmar
-
 Namibia
-
 Nepal
Nepal
-
 Netherlands
-
 New Zealand
-
 Nigeria
-
 North Macedonia
-
 Norway
-
 Oman
Oman
-
 Pakistan
-
 Palestine
-
 Panama
-
 Papua New Guinea
-
 Paraguay
-
 Peru
Peru
-
 Philippines
-
 Poland
-
 Portugal
-
 Puerto Rico
-
 Qatar
Qatar
-
 Reunion
-
 Romania
-
 Rwanda
-
 Saudi Arabia
-
 Serbia
-
 Singapore
-
 Slovakia
-
 Slovenia
-
 Somalia
-
 South Africa
-
 Spain
Spain
-
 Sri Lanka
-
 Sweden
-
 Switzerland
-
 Syria
Syria
-
 Taiwan
-
 Tajikistan
-
 Tanzania
-
 Thailand
-
 Trinidad and Tobago
-
 Tunisia
-
 Turkey
-
 UAE
UAE
-
 Uganda
-
 Ukraine
-
 United Kingdom
-
United States
-
 Uruguay
-
 Uzbekistan
-
 Venezuela
-
 Vietnam
-
 Yemen
Yemen
-
 Zambia
-
 Zimbabwe
- Forex
- Crypto
