
Solana rises, anchored in recent 7-day range amid high volatility – weekly review

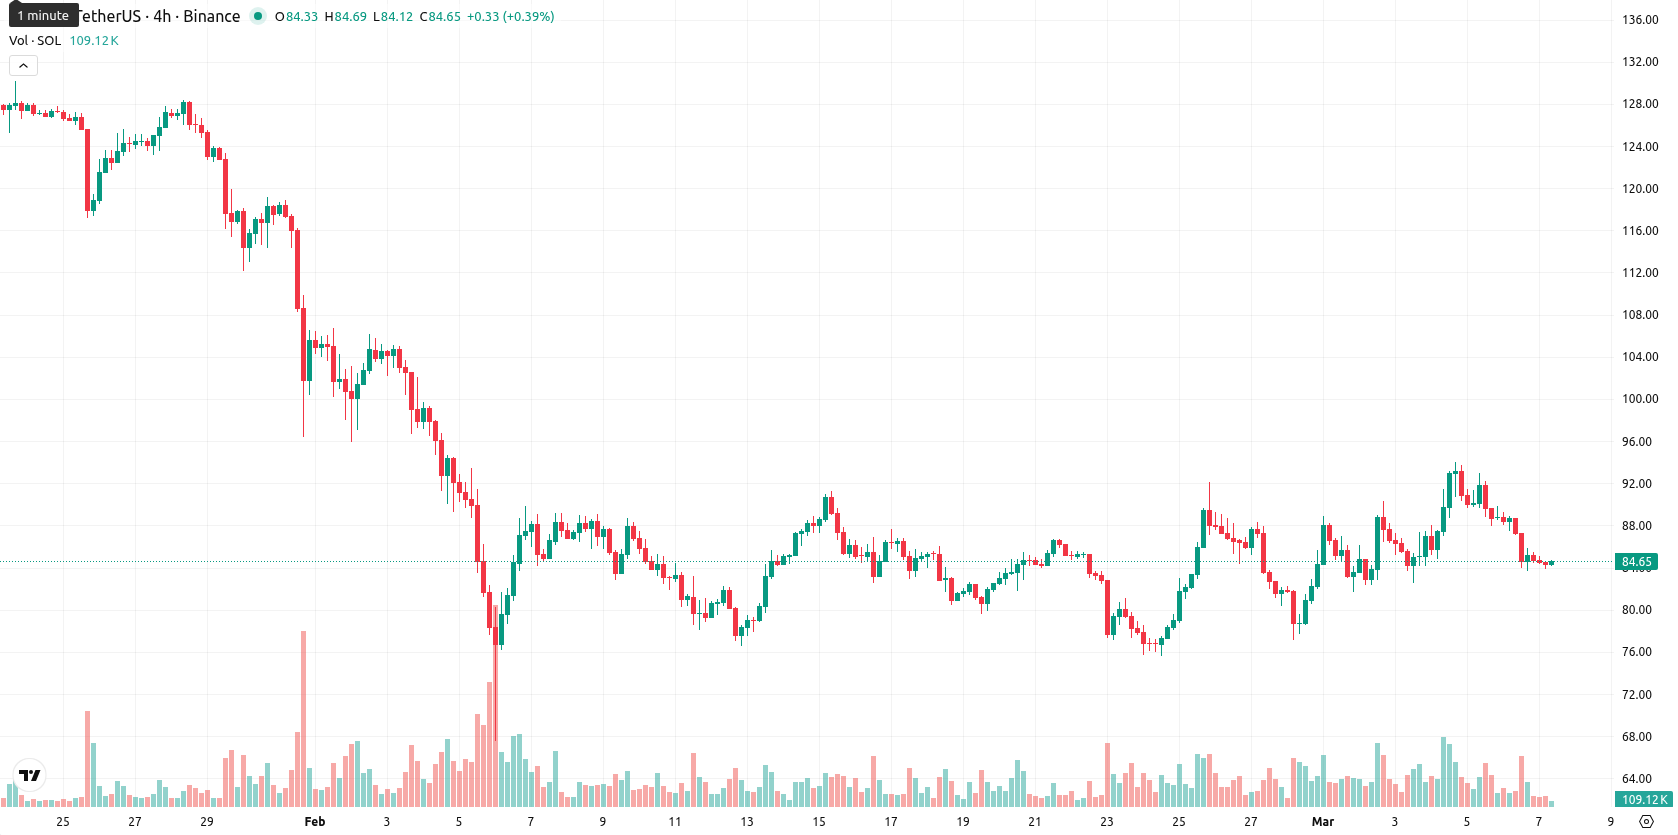
Solana (SOL) is currently trading at $84.63, marking a modest weekly gain of 1.17%. The price remains well below its weekly MA-20 ($126.11), MA-50 ($154.27), and MA-200 ($103.57), signaling sustained bearish momentum and continued selling pressure over the past week.
Highlights
- SOL price remains under sustained bearish pressure, trading well below major moving averages and showing ongoing negative momentum.
- All key momentum indicators signal a strong sell bias with oversold conditions, confirming dominant seller control and weak trend strength.
- Over the next week, SOL is likely to consolidate between $76.00 and $93.00, with a much higher probability of decline than recovery.
Institutional inflows and asset tokenization as weekly adoption accelerates
Solana’s recent ETF launches have driven strong institutional inflows, with approximately $1.5 billion invested and a significant portion of assets held by institutions reporting via 13F filings, demonstrating ongoing commitment. On-chain activity also remains robust, shown by steady payment volume growth and a larger validator network. Additionally, the market capitalization of tokenized real-world assets on the Solana network exceeded $1.7 billion in early March 2026, highlighting increased adoption within asset tokenization.
Oversold extremes and persistent downside as technicals reinforce sell bias
On the weekly chart, SOL continues to trade well below the MA-20, MA-50, and MA-200, with these moving averages serving as substantial dynamic resistance. Weekly momentum indicators remain negative: MACD and ADX both indicate a persistent sell bias and weak trend strength; RSI sits near 30, flagging ongoing oversold conditions. The Stochastic RSI and CCI confirm this oversold environment, while deeply negative Bull/Bear Power and the negative Awesome Oscillator reading further confirm strong seller control. Volatility is high at 15.13%, and the price remains anchored in the lower portion of the weekly range, suggesting no meaningful reversal.
Sideways range favored this week as breakout odds remain low
For the upcoming 5–7 trading days, SOL is expected to consolidate within the $76.00 to $93.00 range, reflecting both recent volatility and the prevailing downtrend on the weekly timeframe. With none of the four major weekly momentum indicators turning bullish and most pointing to continued selling, a breakout to the upside remains unlikely, with less than a 20% probability of a price advance. The baseline scenario suggests continued sideways movement under bearish influence; recovery would only become plausible if the price establishes support above $93.00, targeting the $100.00 area. Conversely, a breakdown below $76.00 could trigger a retreat toward support in the high $60s.
Previously it was reported that Solana is trading slightly below its short-term moving averages and well under longer-term trend lines, with core technical indicators such as the MACD, RSI, and ADX signaling continued bearish momentum and downside pressure. Immediate resistance remains at the Ichimoku Kijun near $84.84 and support at $80.00, with price action expected to consolidate within a lower range and a low probability of short-term upside unless momentum shifts decisively.


Latest Solana News


-
 Afghanistan
-
 Albania
-
 Algeria
-
 Angola
-
 Argentina
-
 Armenia
-
 Australia
-
 Austria
-
 Azerbaijan
-
 Bahamas
-
 Bahrain
-
 Bangladesh
-
 Belarus
-
 Belgium
-
 Bolivia
-
 Botswana
-
 Brazil
-
 Brunei
-
 Bulgaria
-
 Cambodia
-
 Cameroon
-
 Canada
-
 Chile
Chile
-
 China
China
-
 Colombia
-
 Congo
Congo
-
 Costa Rica
-
 Cote d'Ivoire
-
 Croatia
-
 Cuba
Cuba
-
 Cyprus
-
 Czechia
-
 DR Congo
-
 Denmark
-
 Dominican Republic
-
 Ecuador
-
 Egypt
Egypt
-
 El Salvador
-
 Estonia
-
 Eswatini
-
 Ethiopia
-
 Finland
-
 France
-
 Georgia
-
 Germany
-
 Ghana
Ghana
-
 Greece
-
 Haiti
Haiti
-
 Hong Kong
-
 Hungary
-
 India
India
-
 Indonesia
-
 Iran, Islamic republic
-
 Iraq
Iraq
-
 Ireland
-
 Israel
-
 Italy
Italy
-
 Jamaica
-
 Japan
Japan
-
 Jordan
-
 Kazakhstan
-
 Kenya
Kenya
-
 Korea
Korea
-
 Kuwait
-
 Kyrgyzstan
-
 Laos
Laos
-
 Latvia
-
 Lebanon
-
 Lesotho
-
 Libya
Libya
-
 Lithuania
-
 Luxembourg
-
 Madagascar
-
 Malaysia
-
 Malta
Malta
-
 Mauritius
-
 Mexico
-
 Moldova
-
 Mongolia
-
 Montenegro
-
 Morocco
-
 Mozambique
-
 Myanmar
-
 Namibia
-
 Nepal
Nepal
-
 Netherlands
-
 New Zealand
-
 Nigeria
-
 North Macedonia
-
 Norway
-
 Oman
Oman
-
 Pakistan
-
 Palestine
-
 Panama
-
 Papua New Guinea
-
 Paraguay
-
 Peru
Peru
-
 Philippines
-
 Poland
-
 Portugal
-
 Puerto Rico
-
 Qatar
Qatar
-
 Reunion
-
 Romania
-
 Rwanda
-
 Saudi Arabia
-
 Serbia
-
 Singapore
-
 Slovakia
-
 Slovenia
-
 Somalia
-
 South Africa
-
 Spain
Spain
-
 Sri Lanka
-
 Sweden
-
 Switzerland
-
 Syria
Syria
-
 Taiwan
-
 Tajikistan
-
 Tanzania
-
 Thailand
-
 Trinidad and Tobago
-
 Tunisia
-
 Turkey
-
 UAE
UAE
-
 Uganda
-
 Ukraine
-
 United Kingdom
-
United States
-
 Uruguay
-
 Uzbekistan
-
 Venezuela
-
 Vietnam
-
 Yemen
Yemen
-
 Zambia
-
 Zimbabwe
- Forex
- Crypto
