
Solana price climbs despite March 9 ETF net outflows

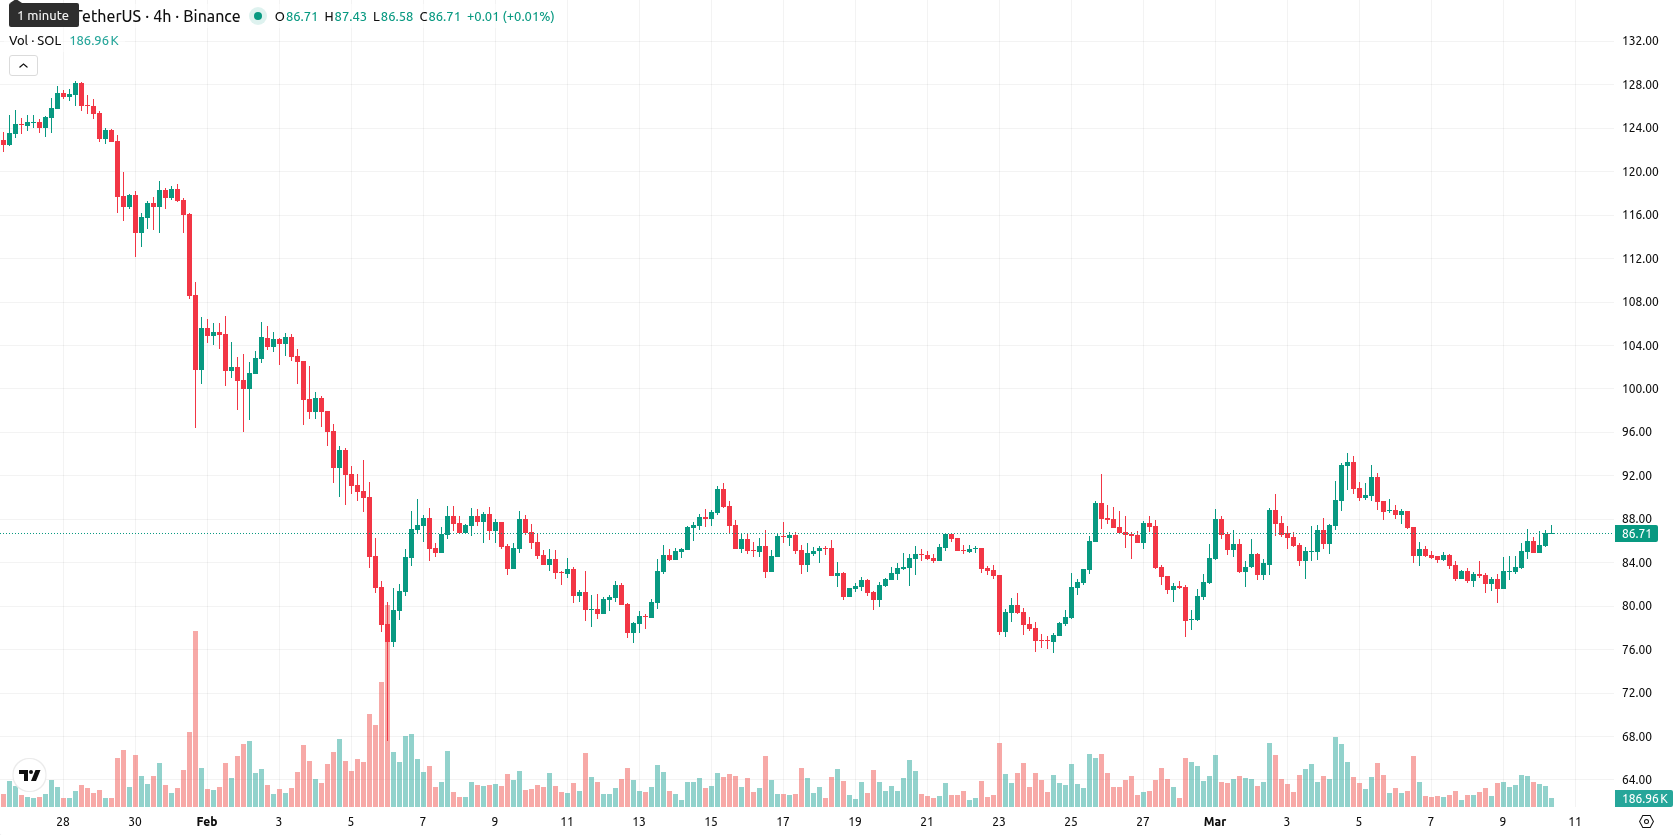
Solana (SOL) is trading at $87.16, up 4.82% today. The asset is positioned above the MA-20 ($84.27) but remains below the MA-50 ($95.74) and MA-200 ($152.88), indicating short-term strength while longer-term trends are under continued seller pressure.
Highlights
- US spot Solana ETFs saw a significant one-day net outflow of 68,933 SOL as investors de-risk amid market turmoil.
- Institutional activity remains subdued due to ongoing SEC scrutiny and unresolved Solana ETF regulatory status, magnifying geo-economic risks.
- SOL price is expected to consolidate between $83.00–$92.00 over the next five days, with technical indicators favoring downside continuation.
ETF outflows accelerate as regulatory and geopolitical risks mount
On March 9, 2026, U.S. spot Solana ETFs recorded a substantial one-day net outflow of 68,933 SOL, reflecting a broader de-risking move that also affected other major crypto ETFs. Macroeconomic and geopolitical headwinds, such as conflict in the Middle East and global shipping disruptions, have heightened volatility and curbed institutional demand, impacting Solana’s trading activity. Meanwhile, ongoing scrutiny from the U.S. Securities and Exchange Commission continues to restrict institutional participation and casts uncertainty on the legal status of Solana ETF products. Regulatory pressure and unresolved federal action outcomes further depress capital inflows and add geo-economic risk for Solana exposure.
Support holds but downtrend prevails amid mixed technical signals
Technically, SOL is finding support just above the Ichimoku Kijun level at $84.84 but faces resistance from the MA-50 and MA-200 at $95.74 and $152.88. Momentum indicators are mixed — MACD signals a strong selling bias, ADX confirms a prevailing downtrend, and RSI at 46.69 leans bearish, while Stoch RSI at 70.22 indicates mild overbought conditions. Both the CCI and Awesome Oscillator are neutral. Bull/Bear Power (BBP) at 1.99 reflects dominant buyer activity on an intraday basis, with price action near session highs and moderate volatility signalling strengthening intraday conditions.
Sideways consolidation likely as upside risk remains limited
Over the next five days, expect SOL to fluctuate within a typical volatility band of $83.00 to $92.00. The probability of a price increase remains low (less than 20%), making further declines more likely. The base scenario is continued sideways consolidation as buyers and sellers appear evenly matched. A decisive break above $92.00 could open the way to the upper teens, while a fall below $83.00 would likely bring support at the $80.00 level into play.
Previously it was reported that, despite a notable decline in Solana’s price and a broader market correction, institutional inflows into spot Solana ETFs have remained steady, with more than $540 million in positions held by major financial firms such as Electric Capital and Goldman Sachs. Technical indicators reflect a downtrend with Solana trading below key moving averages, while momentum metrics suggest oversold conditions as price consolidates near support, potentially setting the stage for stabilization or a rebound if institutional demand persists.


Latest Solana News


-
 Afghanistan
-
 Albania
-
 Algeria
-
 Angola
-
 Argentina
-
 Armenia
-
 Australia
-
 Austria
-
 Azerbaijan
-
 Bahamas
-
 Bahrain
-
 Bangladesh
-
 Belarus
-
 Belgium
-
 Bolivia
-
 Botswana
-
 Brazil
-
 Brunei
-
 Bulgaria
-
 Cambodia
-
 Cameroon
-
 Canada
-
 Chile
Chile
-
 China
China
-
 Colombia
-
 Congo
Congo
-
 Costa Rica
-
 Cote d'Ivoire
-
 Croatia
-
 Cuba
Cuba
-
 Cyprus
-
 Czechia
-
 DR Congo
-
 Denmark
-
 Dominican Republic
-
 Ecuador
-
 Egypt
Egypt
-
 El Salvador
-
 Estonia
-
 Eswatini
-
 Ethiopia
-
 Finland
-
 France
-
 Georgia
-
 Germany
-
 Ghana
Ghana
-
 Greece
-
 Haiti
Haiti
-
 Hong Kong
-
 Hungary
-
 India
India
-
 Indonesia
-
 Iran, Islamic republic
-
 Iraq
Iraq
-
 Ireland
-
 Israel
-
 Italy
Italy
-
 Jamaica
-
 Japan
Japan
-
 Jordan
-
 Kazakhstan
-
 Kenya
Kenya
-
 Korea
Korea
-
 Kuwait
-
 Kyrgyzstan
-
 Laos
Laos
-
 Latvia
-
 Lebanon
-
 Lesotho
-
 Libya
Libya
-
 Lithuania
-
 Luxembourg
-
 Madagascar
-
 Malaysia
-
 Malta
Malta
-
 Mauritius
-
 Mexico
-
 Moldova
-
 Mongolia
-
 Montenegro
-
 Morocco
-
 Mozambique
-
 Myanmar
-
 Namibia
-
 Nepal
Nepal
-
 Netherlands
-
 New Zealand
-
 Nigeria
-
 North Macedonia
-
 Norway
-
 Oman
Oman
-
 Pakistan
-
 Palestine
-
 Panama
-
 Papua New Guinea
-
 Paraguay
-
 Peru
Peru
-
 Philippines
-
 Poland
-
 Portugal
-
 Puerto Rico
-
 Qatar
Qatar
-
 Reunion
-
 Romania
-
 Rwanda
-
 Saudi Arabia
-
 Serbia
-
 Singapore
-
 Slovakia
-
 Slovenia
-
 Somalia
-
 South Africa
-
 Spain
Spain
-
 Sri Lanka
-
 Sweden
-
 Switzerland
-
 Syria
Syria
-
 Taiwan
-
 Tajikistan
-
 Tanzania
-
 Thailand
-
 Trinidad and Tobago
-
 Tunisia
-
 Turkey
-
 UAE
UAE
-
 Uganda
-
 Ukraine
-
 United Kingdom
-
United States
-
 Uruguay
-
 Uzbekistan
-
 Venezuela
-
 Vietnam
-
 Yemen
Yemen
-
 Zambia
-
 Zimbabwe
- Forex
- Crypto
