
Stellar price prediction: Sideways trade likely as XLM gains 8.18% on strong volumes

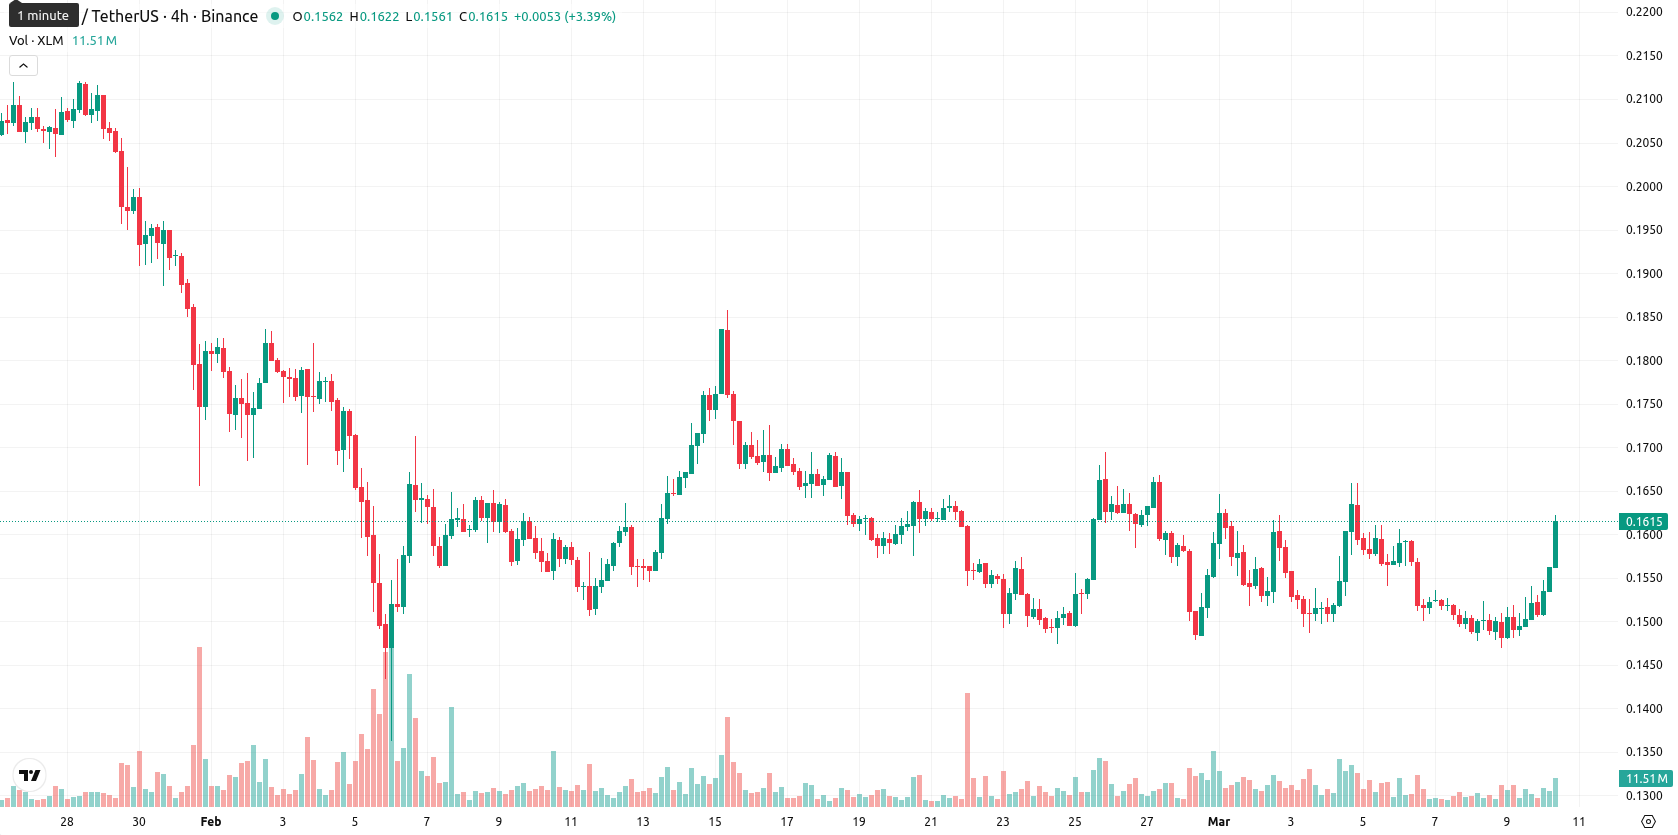
Stellar (XLM) is trading at $0.1613 after climbing 8.18% today, opening with a small upward gap and reaching near session highs of $0.1620. The price sits just above the short-term SMA-20 ($0.1561), remains below the SMA-50 ($0.1721), and is well under the SMA-200 ($0.2672), indicating a mild short-term recovery but ongoing downside pressure across medium- and long-term trends.
Highlights
- DTCC's 2026 patent formally recognizes Stellar's XLM as a cross-chain digital liquidity bridge, significantly validating its blockchain settlement role.
- Sustained trading activity keeps Stellar among the top 30 cryptocurrencies, averaging $52.4 million in daily volume throughout 2026.
- Technicals remain bearish, with XLM expected to trade between $0.155 and $0.168 and downside risk prevailing despite short-term volatility.
Market validation grows as DTCC patent adopts XLM for asset settlement
On March 9, 2026, the Depository Trust and Clearing Corporation (DTCC) included Stellar's XLM as a 'digital liquidity bridge' within a formal patent for settling tokenized assets across blockchains, which the market views as significant validation of Stellar's technology. This development could encourage further experimentation with Stellar by banks and financial institutions for tokenization use cases. Stellar has also maintained notable trading volumes in 2026, with an average of $52.4 million and continued presence among the top 30 cryptocurrencies by market capitalization.
Bearish pressure persists as momentum indicators diverge near resistance
Momentum readings point to mixed signals: the MACD on D1 shows strong selling bias while the ADX indicates only modest trend strength. The RSI stands weak at 40.68 and the CCI is deeply oversold, suggesting persistent bearish sentiment even as the Stoch RSI signals a short-term buy. BBP remains slightly negative, reflecting mild seller dominance intraday. Price action demonstrates momentum strength toward the top of the daily range, with volatility elevated as XLM tests immediate resistance at the Ichimoku Kijun ($0.1664).
Sideways movement favored as bullish breakout risk remains limited
Over the next five trading days, XLM is expected to remain within the $0.155 to $0.168 volatility band relative to current levels, based on current momentum and technical resistance. The probability of a sustained price increase is judged as very low (less than 20%), with further downside more likely according to bearish weekly signals from MA-50, RSI, ADX, and MACD. The most likely scenario is that XLM trades sideways between $0.155 and $0.168. A decisive bullish move above $0.1664 could open a push toward the upper end of the band, while a drop below $0.155 would expose deeper technical support levels.
Previously it was reported that Stellar (XLM) remains under firm bearish control, trading well below key moving averages with all primary technical indicators—such as MACD, ADX, and a deeply oversold RSI—reinforcing ongoing downside momentum and lack of bullish signals. The asset is expected to consolidate within a narrow weekly range between $0.1340 and $0.1640, with any close below support likely to extend losses, while only a sustained move above resistance would suggest early signs of recovery.


Latest Stellar News


-
 Afghanistan
-
 Albania
-
 Algeria
-
 Angola
-
 Argentina
-
 Armenia
-
 Australia
-
 Austria
-
 Azerbaijan
-
 Bahamas
-
 Bahrain
-
 Bangladesh
-
 Belarus
-
 Belgium
-
 Bolivia
-
 Botswana
-
 Brazil
-
 Brunei
-
 Bulgaria
-
 Cambodia
-
 Cameroon
-
 Canada
-
 Chile
Chile
-
 China
China
-
 Colombia
-
 Congo
Congo
-
 Costa Rica
-
 Cote d'Ivoire
-
 Croatia
-
 Cuba
Cuba
-
 Cyprus
-
 Czechia
-
 DR Congo
-
 Denmark
-
 Dominican Republic
-
 Ecuador
-
 Egypt
Egypt
-
 El Salvador
-
 Estonia
-
 Eswatini
-
 Ethiopia
-
 Finland
-
 France
-
 Georgia
-
 Germany
-
 Ghana
Ghana
-
 Greece
-
 Haiti
Haiti
-
 Hong Kong
-
 Hungary
-
 India
India
-
 Indonesia
-
 Iran, Islamic republic
-
 Iraq
Iraq
-
 Ireland
-
 Israel
-
 Italy
Italy
-
 Jamaica
-
 Japan
Japan
-
 Jordan
-
 Kazakhstan
-
 Kenya
Kenya
-
 Korea
Korea
-
 Kuwait
-
 Kyrgyzstan
-
 Laos
Laos
-
 Latvia
-
 Lebanon
-
 Lesotho
-
 Libya
Libya
-
 Lithuania
-
 Luxembourg
-
 Madagascar
-
 Malaysia
-
 Malta
Malta
-
 Mauritius
-
 Mexico
-
 Moldova
-
 Mongolia
-
 Montenegro
-
 Morocco
-
 Mozambique
-
 Myanmar
-
 Namibia
-
 Nepal
Nepal
-
 Netherlands
-
 New Zealand
-
 Nigeria
-
 North Macedonia
-
 Norway
-
 Oman
Oman
-
 Pakistan
-
 Palestine
-
 Panama
-
 Papua New Guinea
-
 Paraguay
-
 Peru
Peru
-
 Philippines
-
 Poland
-
 Portugal
-
 Puerto Rico
-
 Qatar
Qatar
-
 Reunion
-
 Romania
-
 Rwanda
-
 Saudi Arabia
-
 Serbia
-
 Singapore
-
 Slovakia
-
 Slovenia
-
 Somalia
-
 South Africa
-
 Spain
Spain
-
 Sri Lanka
-
 Sweden
-
 Switzerland
-
 Syria
Syria
-
 Taiwan
-
 Tajikistan
-
 Tanzania
-
 Thailand
-
 Trinidad and Tobago
-
 Tunisia
-
 Turkey
-
 UAE
UAE
-
 Uganda
-
 Ukraine
-
 United Kingdom
-
United States
-
 Uruguay
-
 Uzbekistan
-
 Venezuela
-
 Vietnam
-
 Yemen
Yemen
-
 Zambia
-
 Zimbabwe
- Forex
- Crypto
