
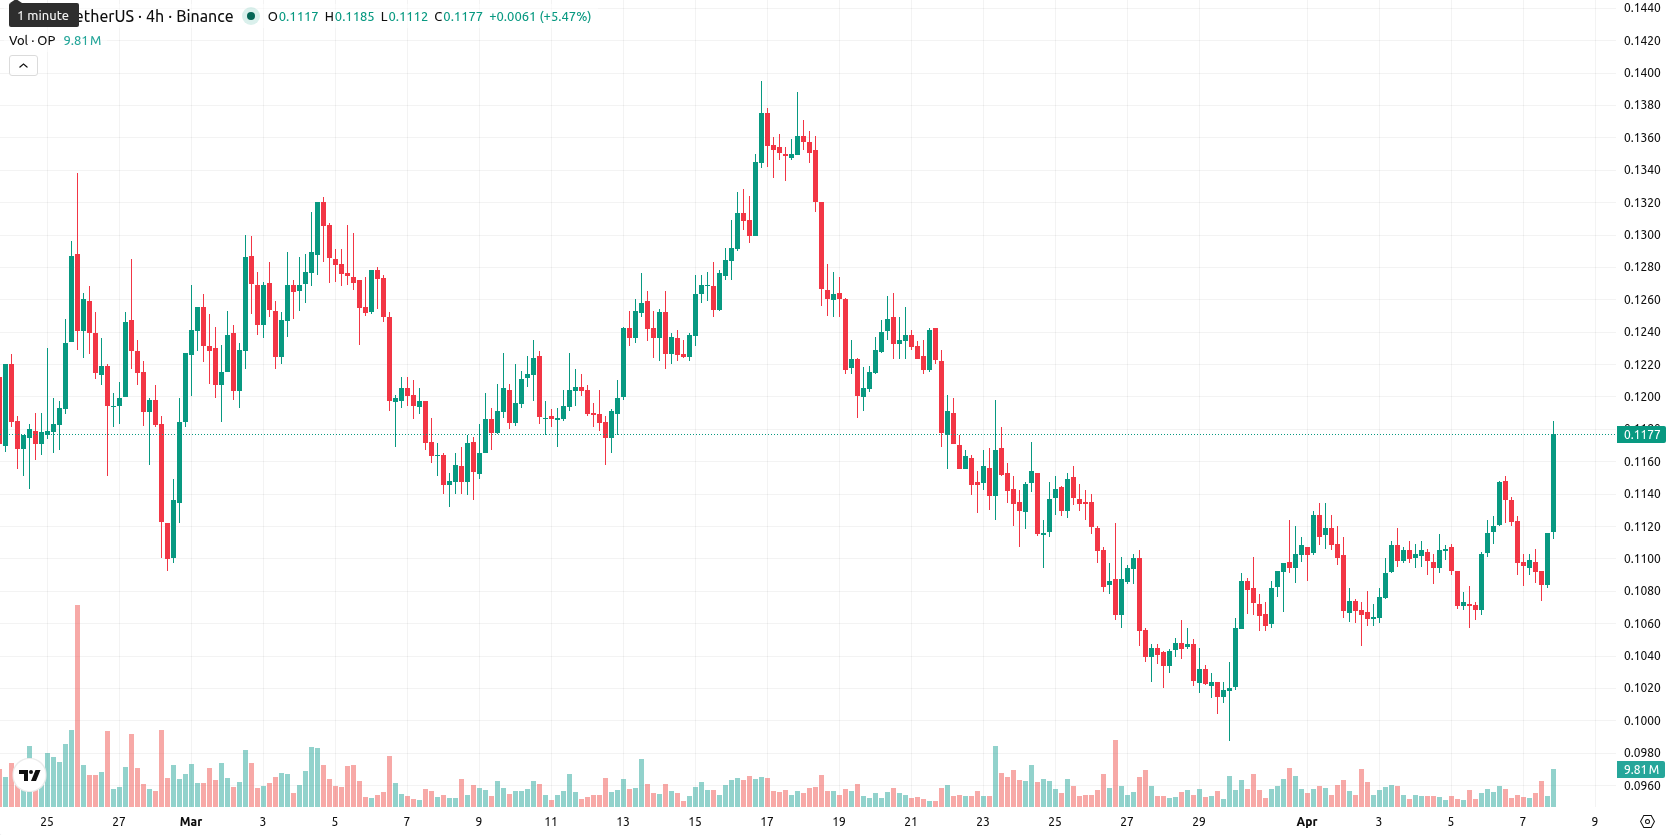
Optimism price prediction: Can $0.1191 resistance cap OP 7.19% advance?

Optimism (OP) is trading at $0.1178 after moving up 7.19% for the day. The price sits above the SMA-20 ($0.1118), but remains below the SMA-50 ($0.1226) and well under the SMA-200 ($0.3181), highlighting short-term bullish pressure amid broader medium- and long-term weakness.
Highlights
- Short-term bullish momentum in OP is opposed by prevailing medium- and long-term selling pressure, capping sustained upside risk.
- Momentum signals are mixed, with daily indicators suggesting overbought conditions and potential for near-term exhaustion after sharp intraday gains.
- Price is expected to consolidate within a $0.1120 to $0.1210 range, with sub-20% probability of a breakout to the upside.
Mixed signals as short-term strength meets resistance and momentum loss
Technically, OP’s short-term positioning above the SMA-20 suggests near-term bullish momentum, while being below the SMA-50 and SMA-200, with the Ichimoku Kijun at $0.1191 overhead, underlines ongoing resistance. On the daily chart, MACD and ADX both continue to point to downside risk; RSI remains neutral-to-weak at 40, and Stoch RSI is deeply overbought, reflecting the potential for near-term exhaustion. BBP suggests active buyers, supported by a sharp 7.19% intraday rally after an early gap down, but mixed oscillators reflect a market locked between renewed upward momentum and the possibility of overextension.
Sideways bias expected as upside capped by resistance
Over the next five days, OP is likely to trade between $0.1120 and $0.1210 — a typical volatility band relative to current levels. The probability of a further price increase is low (less than 20%), and persistent weekly sell signals point to the likelihood of further downside or consolidation. The baseline scenario is sideways movement; a bullish move would require a solid breakout above $0.1191 resistance, while renewed selling could push the price under $0.1120 support.
Earlier, analysts noted that Optimism’s recovery was being constrained by persistent medium- to long-term bearish signals, keeping the asset in a cautious trading posture. This latest action reinforces that caution, as renewed short-term momentum is tempered by clear overhead resistance and lingering downside risk, making OP highly sensitive to any break above or below the $0.1191 and $0.1120 levels in the days ahead.


Latest Optimism News


-
 Afghanistan
-
 Albania
-
 Algeria
-
 Angola
-
 Argentina
-
 Armenia
-
 Australia
-
 Austria
-
 Azerbaijan
-
 Bahamas
-
 Bahrain
-
 Bangladesh
-
 Belarus
-
 Belgium
-
 Bolivia
-
 Botswana
-
 Brazil
-
 Brunei
-
 Bulgaria
-
 Cambodia
-
 Cameroon
-
 Canada
-
 Chile
Chile
-
 China
China
-
 Colombia
-
 Congo
Congo
-
 Costa Rica
-
 Cote d'Ivoire
-
 Croatia
-
 Cuba
Cuba
-
 Cyprus
-
 Czechia
-
 DR Congo
-
 Denmark
-
 Dominican Republic
-
 Ecuador
-
 Egypt
Egypt
-
 El Salvador
-
 Estonia
-
 Eswatini
-
 Ethiopia
-
 Finland
-
 France
-
 Georgia
-
 Germany
-
 Ghana
Ghana
-
 Greece
-
 Haiti
Haiti
-
 Hong Kong
-
 Hungary
-
 India
India
-
 Indonesia
-
 Iran, Islamic republic
-
 Iraq
Iraq
-
 Ireland
-
 Israel
-
 Italy
Italy
-
 Jamaica
-
 Japan
Japan
-
 Jordan
-
 Kazakhstan
-
 Kenya
Kenya
-
 Korea
Korea
-
 Kuwait
-
 Kyrgyzstan
-
 Laos
Laos
-
 Latvia
-
 Lebanon
-
 Lesotho
-
 Libya
Libya
-
 Lithuania
-
 Luxembourg
-
 Madagascar
-
 Malaysia
-
 Malta
Malta
-
 Mauritius
-
 Mexico
-
 Moldova
-
 Mongolia
-
 Montenegro
-
 Morocco
-
 Mozambique
-
 Myanmar
-
 Namibia
-
 Nepal
Nepal
-
 Netherlands
-
 New Zealand
-
 Nigeria
-
 North Macedonia
-
 Norway
-
 Oman
Oman
-
 Pakistan
-
 Palestine
-
 Panama
-
 Papua New Guinea
-
 Paraguay
-
 Peru
Peru
-
 Philippines
-
 Poland
-
 Portugal
-
 Puerto Rico
-
 Qatar
Qatar
-
 Reunion
-
 Romania
-
 Rwanda
-
 Saudi Arabia
-
 Serbia
-
 Singapore
-
 Slovakia
-
 Slovenia
-
 Somalia
-
 South Africa
-
 Spain
Spain
-
 Sri Lanka
-
 Sweden
-
 Switzerland
-
 Syria
Syria
-
 Taiwan
-
 Tajikistan
-
 Tanzania
-
 Thailand
-
 Trinidad and Tobago
-
 Tunisia
-
 Turkey
-
 UAE
UAE
-
 Uganda
-
 Ukraine
-
 United Kingdom
-
United States
-
 Uruguay
-
 Uzbekistan
-
 Venezuela
-
 Vietnam
-
 Yemen
Yemen
-
 Zambia
-
 Zimbabwe
- Forex
- Crypto
