
TIA rallies 33.68% with price capped below key moving averages: weekly forecast

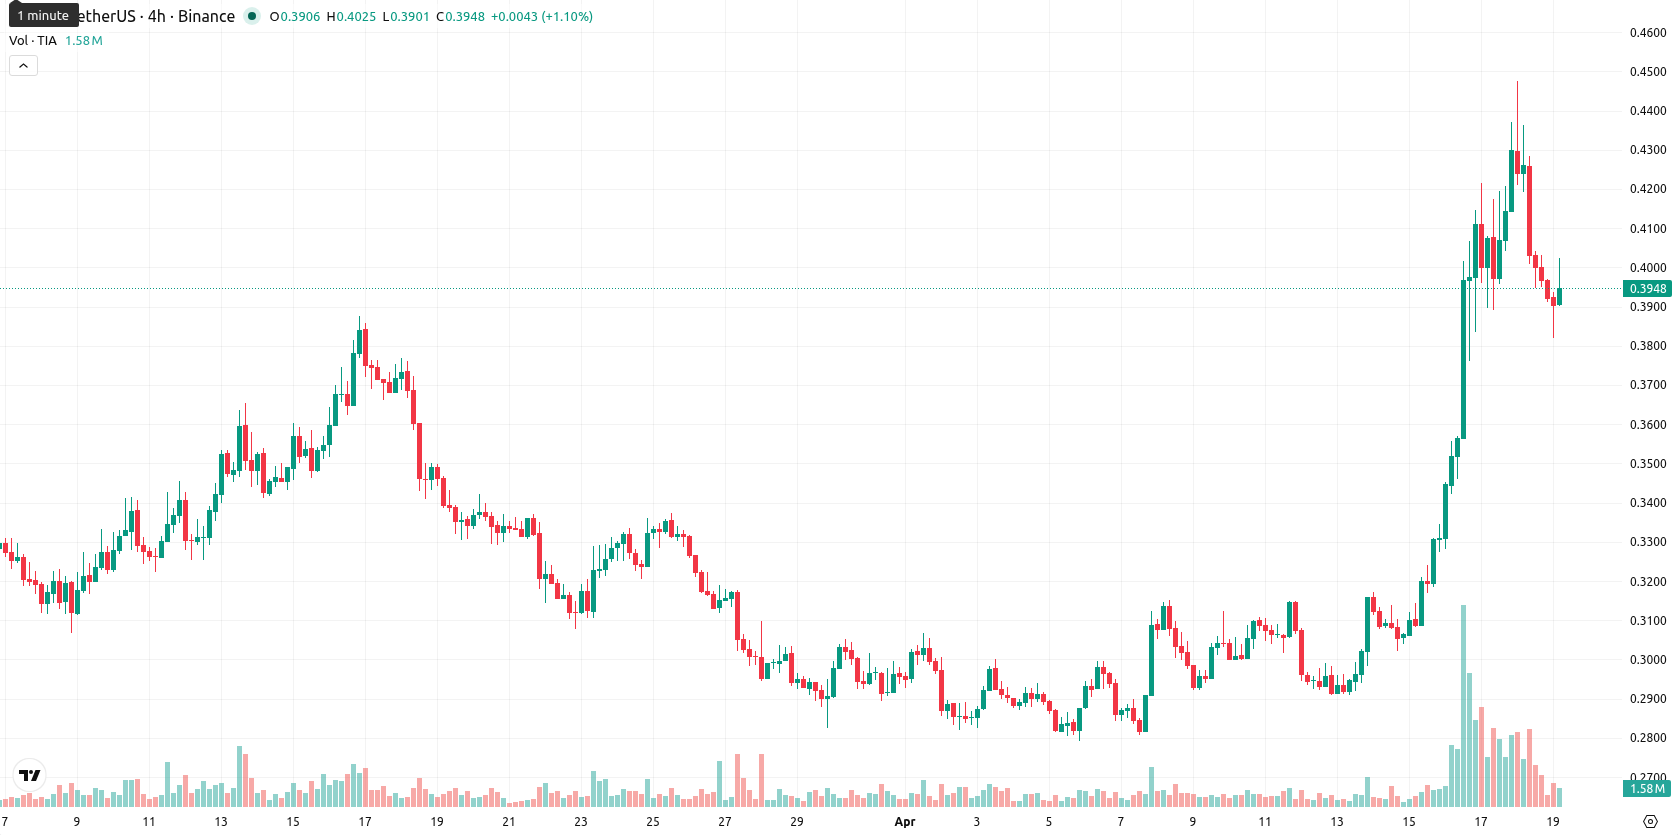
Celestia (TIA) closed the week at $0.3953, posting a strong gain of $0.0996 or 33.68% from the previous weekly close and settling in the upper part of its weekly range. Despite this sharp recovery, TIA remains below its MA-20 ($0.4006), MA-50 ($1.1411), and MA-200 ($0.4732) on the weekly timeframe, signaling persistent medium- and long-term bearish pressure.
Highlights
- TIA has rebounded sharply, posting a 33.68% weekly gain and currently trades in the upper weekly range.
- Multiple technical signals show overbought conditions and weak momentum, with indicators diverging on the underlying strength of the move.
- The baseline forecast predicts a sideways trade between $0.38 and $0.48, with a low probability of an upside breakout.
Buyer dominance offsets weak momentum as technical signals diverge this week
On the weekly chart, TIA continues to face resistance at the MA-20, which now acts as a near-term ceiling, with further overhead resistance at the MA-50 and MA-200. Volatility remains elevated at 53.81%. Weekly support stands at $0.38 and resistance at $0.48. Momentum is mixed, with the MACD giving a strong sell signal and the ADX showing a weak bearish trend. RSI is at 38.4, indicating overbought conditions alongside the Stochastic RSI at 100.0, while the CCI remains neutral. Bull/Bear Power points to strong buyer dominance this week, but the price recovery contrasts with lackluster momentum, highlighting a divergence across technical indicators.
Consolidation favored over breakout as weak momentum limits upside next week
Looking ahead to the next 7 days, TIA is expected to trade sideways within a volatile range between $0.38 and $0.48, with a baseline scenario favoring consolidation near current levels. There is a very low probability (below 20%) of an upside breakout due to weak momentum signals. Should the price manage to clear the $0.48 resistance, a round of short covering may ensue, but this appears unlikely unless momentum indicators turn more positive. On the downside, a break below $0.38 would increase the risk of further declines and a possible retest of support zones.
Earlier, analysts noted that Celestia was exhibiting short-term strength but faced cautionary signals due to persistent overbought conditions and weak momentum, suggesting a near-term risk of choppy consolidation. While the recent weekly rebound shows resilience, traders should monitor whether renewed buyer dominance can sustain a move above $0.48, as failure to do so may signal renewed downside risk amid ongoing volatility.


Latest Celestia News


-
 Afghanistan
-
 Albania
-
 Algeria
-
 Angola
-
 Argentina
-
 Armenia
-
 Australia
-
 Austria
-
 Azerbaijan
-
 Bahamas
-
 Bahrain
-
 Bangladesh
-
 Belarus
-
 Belgium
-
 Bolivia
-
 Botswana
-
 Brazil
-
 Brunei
-
 Bulgaria
-
 Cambodia
-
 Cameroon
-
 Canada
-
 Chile
Chile
-
 China
China
-
 Colombia
-
 Congo
Congo
-
 Costa Rica
-
 Cote d'Ivoire
-
 Croatia
-
 Cuba
Cuba
-
 Cyprus
-
 Czechia
-
 DR Congo
-
 Denmark
-
 Dominican Republic
-
 Ecuador
-
 Egypt
Egypt
-
 El Salvador
-
 Estonia
-
 Eswatini
-
 Ethiopia
-
 Finland
-
 France
-
 Georgia
-
 Germany
-
 Ghana
Ghana
-
 Greece
-
 Haiti
Haiti
-
 Hong Kong
-
 Hungary
-
 India
India
-
 Indonesia
-
 Iran, Islamic republic
-
 Iraq
Iraq
-
 Ireland
-
 Israel
-
 Italy
Italy
-
 Jamaica
-
 Japan
Japan
-
 Jordan
-
 Kazakhstan
-
 Kenya
Kenya
-
 Korea
Korea
-
 Kuwait
-
 Kyrgyzstan
-
 Laos
Laos
-
 Latvia
-
 Lebanon
-
 Lesotho
-
 Libya
Libya
-
 Lithuania
-
 Luxembourg
-
 Madagascar
-
 Malaysia
-
 Malta
Malta
-
 Mauritius
-
 Mexico
-
 Moldova
-
 Mongolia
-
 Montenegro
-
 Morocco
-
 Mozambique
-
 Myanmar
-
 Namibia
-
 Nepal
Nepal
-
 Netherlands
-
 New Zealand
-
 Nigeria
-
 North Macedonia
-
 Norway
-
 Oman
Oman
-
 Pakistan
-
 Palestine
-
 Panama
-
 Papua New Guinea
-
 Paraguay
-
 Peru
Peru
-
 Philippines
-
 Poland
-
 Portugal
-
 Puerto Rico
-
 Qatar
Qatar
-
 Reunion
-
 Romania
-
 Rwanda
-
 Saudi Arabia
-
 Serbia
-
 Singapore
-
 Slovakia
-
 Slovenia
-
 Somalia
-
 South Africa
-
 Spain
Spain
-
 Sri Lanka
-
 Sweden
-
 Switzerland
-
 Syria
Syria
-
 Taiwan
-
 Tajikistan
-
 Tanzania
-
 Thailand
-
 Trinidad and Tobago
-
 Tunisia
-
 Turkey
-
 UAE
UAE
-
 Uganda
-
 Ukraine
-
 United Kingdom
-
United States
-
 Uruguay
-
 Uzbekistan
-
 Venezuela
-
 Vietnam
-
 Yemen
Yemen
-
 Zambia
-
 Zimbabwe
- Forex
- Crypto
