
Solana price prediction: Can $92 resistance hold? SOL trades flat

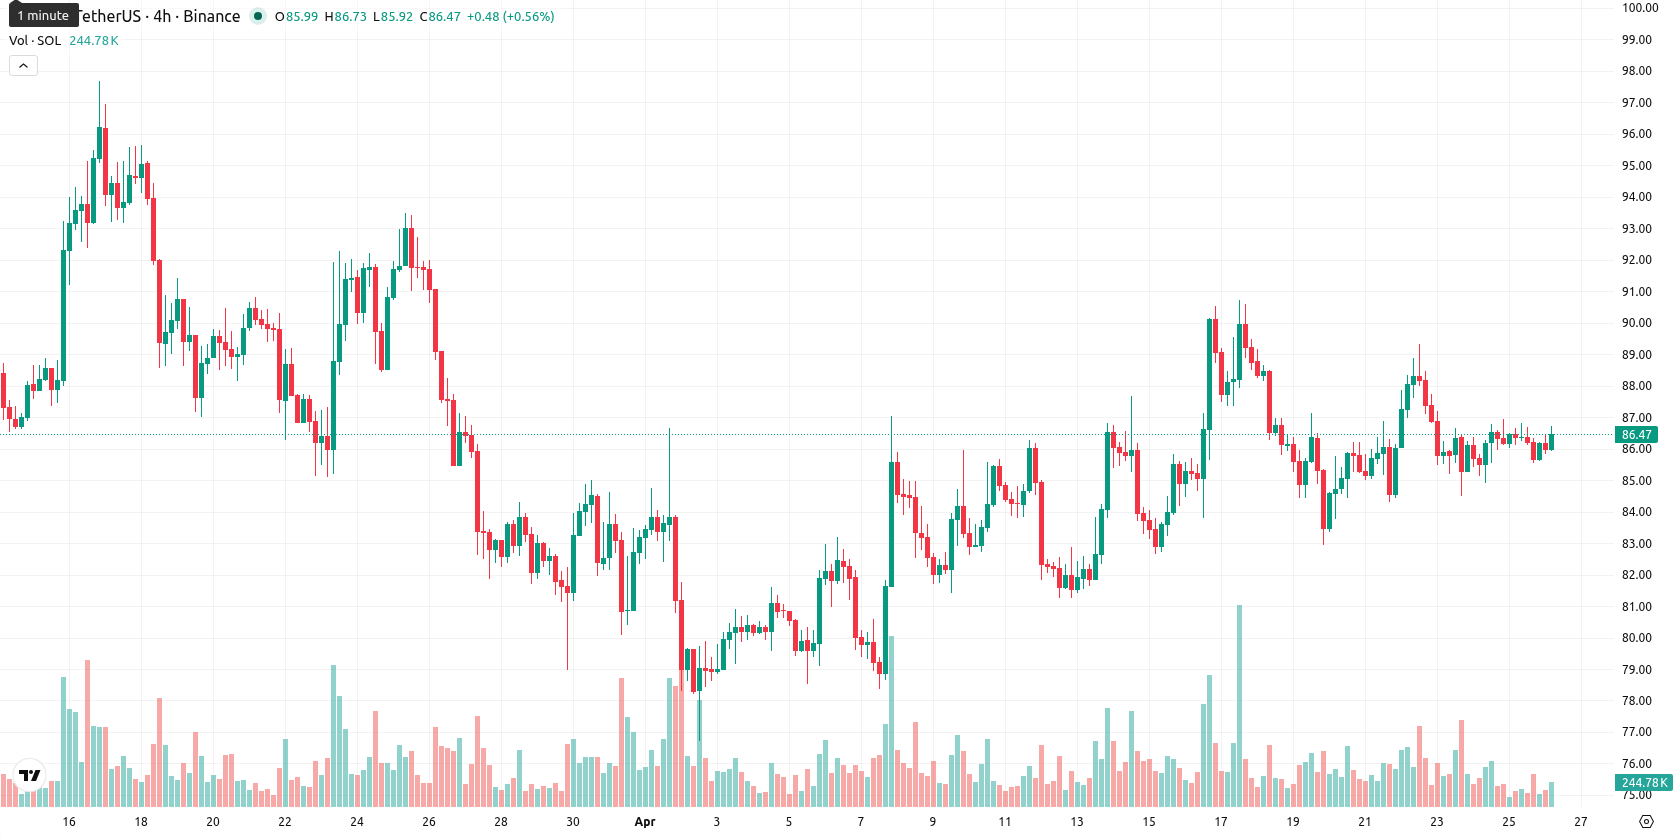
Solana (SOL) is trading at $86.49, up 0.20% for the day and holding above its key short-term moving averages.
Highlights
- Institutional inflows into Solana spot ETFs have continued for five sessions, lifting cumulative assets above $1.02 billion despite product-specific outflows.
- Overall spot ETF trading volumes and volatility in Solana are narrowing, signaling market sensitivity around the $92 technical level.
- Technical signals are mixed, with near-term buying bias but long-term bearish pressure, and a trading range of $82.00–$90.00 expected over the next week unless $90.00 is decisively breached.
ETF inflows drive institutional accumulation as volatility narrows
Solana has seen five consecutive sessions of spot ETF inflows totaling $35.17 million, with cumulative ETF investments now exceeding $1.02 billion. Institutional activity has lifted overall ETF assets above the $1 billion milestone, though some products like TSOL have posted outflows of $102.6 million. Trading volatility and volumes continue to tighten, and technical signals indicate the potential for a breakout move with $92 highlighted as a significant level.
Mixed momentum shows limited trend as key supports hold
SOL is positioned above the MA-20 ($85.10) and MA-50 ($85.78), while the MA-200 at $122.01 remains well above the current price. The Ichimoku Kijun level at $83.72 serves as immediate support; there is no golden or death cross in the moving average structure. Momentum indicators are mixed: MACD issues a Buy alert, and the Awesome Oscillator (AO) also signals Buy, but ADX is weak at 9.10 (neutral), suggesting limited trend strength. Oscillators give a mild bullish tilt with RSI at 51.49 (Buy), while Stoch RSI and CCI hold neutral; BBP at 1.08 (Overbought) indicates buyers dominate intraday, yet no extreme conditions are signaled.
Breakout risk subdued by technical conflicts and fading bullish signals
Over the next five sessions, price action is likely to stay within a typical volatility band of $82.00 – $90.00. The probability of a move above $90.00 is low due to conflicting weekly technicals and broad bearish cues; only one weekly indicator signals Buy. If SOL breaks above $90.00, a brief rebound may occur, but a sustained rally is unlikely. Should the $83.72 Kijun support level fail, a retracement toward the $82.00 – $83.00 zone could be tested soon.
Earlier, analysts noted that Solana was exhibiting sideways price action amidst mixed technical signals and persistent institutional interest, with geopolitical factors contributing to overall market volatility. The latest surge in ETF inflows and sustained positioning above key short-term averages add conviction to the emerging bullish bias, but with tightening volatility bands, traders should closely monitor the $92 level for any potential breakout or rejection.


Latest Solana News


-
 Afghanistan
-
 Albania
-
 Algeria
-
 Angola
-
 Argentina
-
 Armenia
-
 Australia
-
 Austria
-
 Azerbaijan
-
 Bahamas
-
 Bahrain
-
 Bangladesh
-
 Belarus
-
 Belgium
-
 Bolivia
-
 Botswana
-
 Brazil
-
 Brunei
-
 Bulgaria
-
 Cambodia
-
 Cameroon
-
 Canada
-
 Chile
Chile
-
 China
China
-
 Colombia
-
 Congo
Congo
-
 Costa Rica
-
 Cote d'Ivoire
-
 Croatia
-
 Cuba
Cuba
-
 Cyprus
-
 Czechia
-
 DR Congo
-
 Denmark
-
 Dominican Republic
-
 Ecuador
-
 Egypt
Egypt
-
 El Salvador
-
 Estonia
-
 Eswatini
-
 Ethiopia
-
 Finland
-
 France
-
 Georgia
-
 Germany
-
 Ghana
Ghana
-
 Greece
-
 Haiti
Haiti
-
 Hong Kong
-
 Hungary
-
 India
India
-
 Indonesia
-
 Iran, Islamic republic
-
 Iraq
Iraq
-
 Ireland
-
 Israel
-
 Italy
Italy
-
 Jamaica
-
 Japan
Japan
-
 Jordan
-
 Kazakhstan
-
 Kenya
Kenya
-
 Korea
Korea
-
 Kuwait
-
 Kyrgyzstan
-
 Laos
Laos
-
 Latvia
-
 Lebanon
-
 Lesotho
-
 Libya
Libya
-
 Lithuania
-
 Luxembourg
-
 Madagascar
-
 Malaysia
-
 Malta
Malta
-
 Mauritius
-
 Mexico
-
 Moldova
-
 Mongolia
-
 Montenegro
-
 Morocco
-
 Mozambique
-
 Myanmar
-
 Namibia
-
 Nepal
Nepal
-
 Netherlands
-
 New Zealand
-
 Nigeria
-
 North Macedonia
-
 Norway
-
 Oman
Oman
-
 Pakistan
-
 Palestine
-
 Panama
-
 Papua New Guinea
-
 Paraguay
-
 Peru
Peru
-
 Philippines
-
 Poland
-
 Portugal
-
 Puerto Rico
-
 Qatar
Qatar
-
 Reunion
-
 Romania
-
 Rwanda
-
 Saudi Arabia
-
 Serbia
-
 Singapore
-
 Slovakia
-
 Slovenia
-
 Somalia
-
 South Africa
-
 Spain
Spain
-
 Sri Lanka
-
 Sweden
-
 Switzerland
-
 Syria
Syria
-
 Taiwan
-
 Tajikistan
-
 Tanzania
-
 Thailand
-
 Trinidad and Tobago
-
 Tunisia
-
 Turkey
-
 UAE
UAE
-
 Uganda
-
 Ukraine
-
 United Kingdom
-
United States
-
 Uruguay
-
 Uzbekistan
-
 Venezuela
-
 Vietnam
-
 Yemen
Yemen
-
 Zambia
-
 Zimbabwe
- Forex
- Crypto
