
Celestia slips as MACD issues strong sell signal: weekly outlook

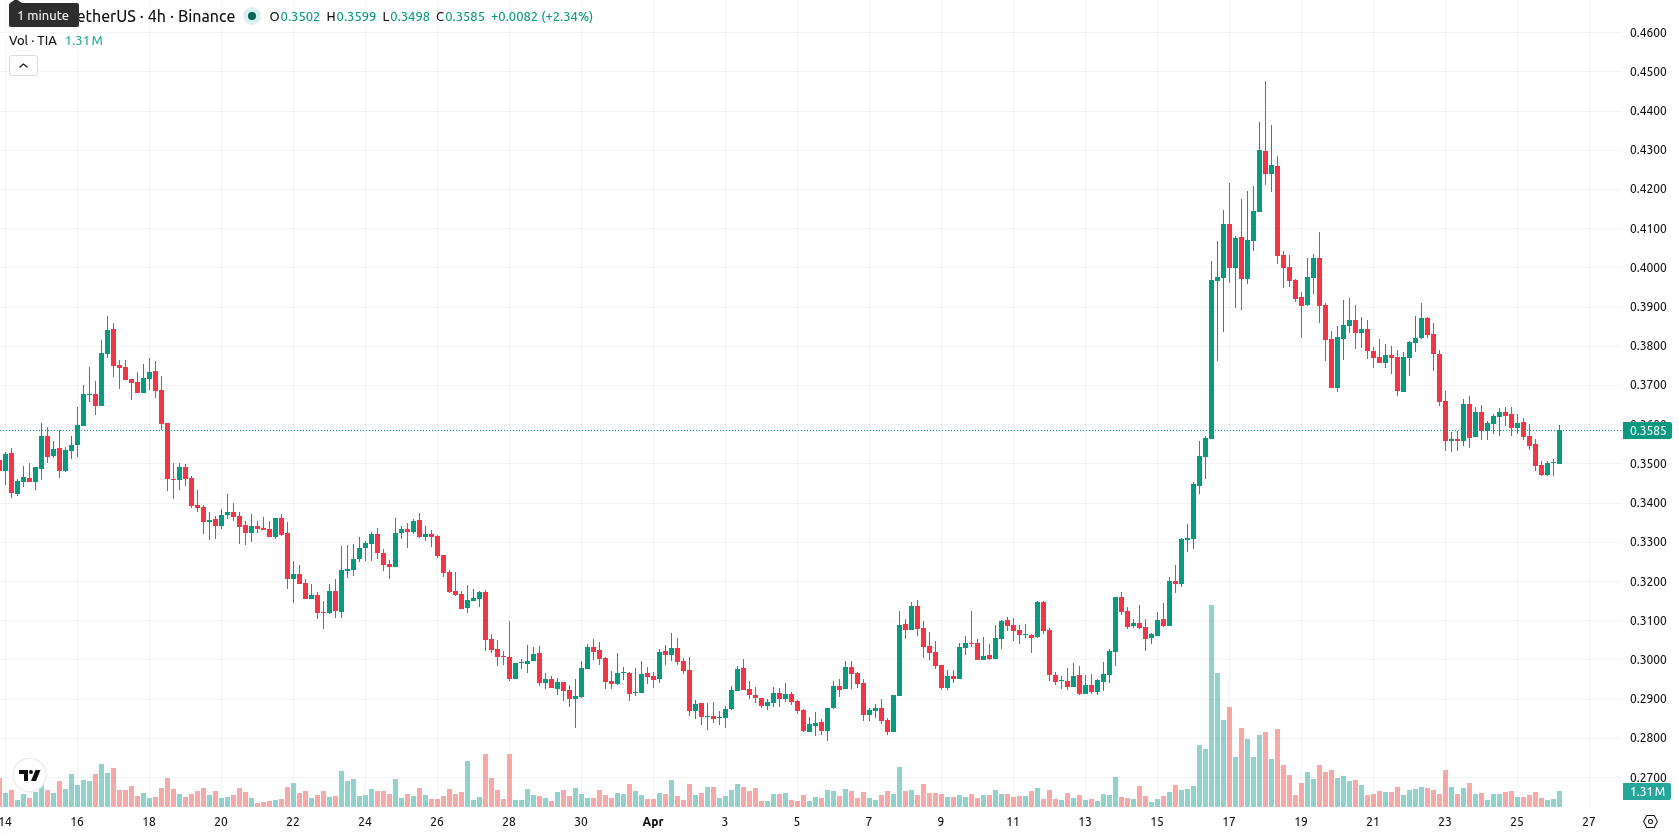
Celestia (TIA) is currently trading at $0.3585, posting a weekly decline of $0.0345 or 8.55%. The asset remains under pressure, positioned below the weekly MA-20 ($0.3890), MA-50 ($1.0834), and MA-200 ($0.4748), with the MA-20 acting as the nearest dynamic resistance.
Highlights
- TIA continues to face selling pressure, trading below key moving averages and sustaining a persistent bearish trend.
- Momentum signals, including MACD and ADX, indicate a strong sell bias, while the Stochastic RSI divergence hints at possible short-term seller fatigue.
- TIA is expected to fluctuate between $0.323 and $0.394 in the coming week, with a greater likelihood of further downside.
Persistent bearish momentum as conflicting indicators signal selling fatigue
On the weekly chart, technical indicators remain bearish. MACD generates a Strong Sell signal, while ADX confirms continued selling pressure. RSI shows a Sell bias, and the Stochastic RSI is deep in overbought territory — a divergence indicating possible near-term selling fatigue. CCI is neutral, Bull/Bear Power is marginally bullish, and the Awesome Oscillator remains trend-agnostic. TIA has spent the week trading in the lower part of its range, with weekly volatility at 13.06%.
Sideways bias expected as breakout risk remains limited next week
For the next seven days, TIA is expected to trade sideways within a range of $0.323 to $0.394. The probability of a significant upside breakout is very low (less than 20%), while a move lower is more likely with no buy signals from key indicators. The baseline scenario favors consolidation unless the price decisively breaks above $0.394 (bullish) or falls below $0.323 (bearish).
Earlier, analysts noted that Celestia was experiencing persistent bearish pressure with expectations of continued range-bound trading amid mixed momentum signals. The latest technical outlook reinforces this cautious stance, highlighting that further downside risk prevails unless a decisive move above $0.394 or below $0.323 establishes a new directional trend.


Latest Celestia News


-
 Afghanistan
-
 Albania
-
 Algeria
-
 Angola
-
 Argentina
-
 Armenia
-
 Australia
-
 Austria
-
 Azerbaijan
-
 Bahamas
-
 Bahrain
-
 Bangladesh
-
 Belarus
-
 Belgium
-
 Bolivia
-
 Botswana
-
 Brazil
-
 Brunei
-
 Bulgaria
-
 Cambodia
-
 Cameroon
-
 Canada
-
 Chile
Chile
-
 China
China
-
 Colombia
-
 Congo
Congo
-
 Costa Rica
-
 Cote d'Ivoire
-
 Croatia
-
 Cuba
Cuba
-
 Cyprus
-
 Czechia
-
 DR Congo
-
 Denmark
-
 Dominican Republic
-
 Ecuador
-
 Egypt
Egypt
-
 El Salvador
-
 Estonia
-
 Eswatini
-
 Ethiopia
-
 Finland
-
 France
-
 Georgia
-
 Germany
-
 Ghana
Ghana
-
 Greece
-
 Haiti
Haiti
-
 Hong Kong
-
 Hungary
-
 India
India
-
 Indonesia
-
 Iran, Islamic republic
-
 Iraq
Iraq
-
 Ireland
-
 Israel
-
 Italy
Italy
-
 Jamaica
-
 Japan
Japan
-
 Jordan
-
 Kazakhstan
-
 Kenya
Kenya
-
 Korea
Korea
-
 Kuwait
-
 Kyrgyzstan
-
 Laos
Laos
-
 Latvia
-
 Lebanon
-
 Lesotho
-
 Libya
Libya
-
 Lithuania
-
 Luxembourg
-
 Madagascar
-
 Malaysia
-
 Malta
Malta
-
 Mauritius
-
 Mexico
-
 Moldova
-
 Mongolia
-
 Montenegro
-
 Morocco
-
 Mozambique
-
 Myanmar
-
 Namibia
-
 Nepal
Nepal
-
 Netherlands
-
 New Zealand
-
 Nigeria
-
 North Macedonia
-
 Norway
-
 Oman
Oman
-
 Pakistan
-
 Palestine
-
 Panama
-
 Papua New Guinea
-
 Paraguay
-
 Peru
Peru
-
 Philippines
-
 Poland
-
 Portugal
-
 Puerto Rico
-
 Qatar
Qatar
-
 Reunion
-
 Romania
-
 Rwanda
-
 Saudi Arabia
-
 Serbia
-
 Singapore
-
 Slovakia
-
 Slovenia
-
 Somalia
-
 South Africa
-
 Spain
Spain
-
 Sri Lanka
-
 Sweden
-
 Switzerland
-
 Syria
Syria
-
 Taiwan
-
 Tajikistan
-
 Tanzania
-
 Thailand
-
 Trinidad and Tobago
-
 Tunisia
-
 Turkey
-
 UAE
UAE
-
 Uganda
-
 Ukraine
-
 United Kingdom
-
United States
-
 Uruguay
-
 Uzbekistan
-
 Venezuela
-
 Vietnam
-
 Yemen
Yemen
-
 Zambia
-
 Zimbabwe
- Forex
- Crypto
