
Sonic falls 8.05% as sellers dominate short-term moves

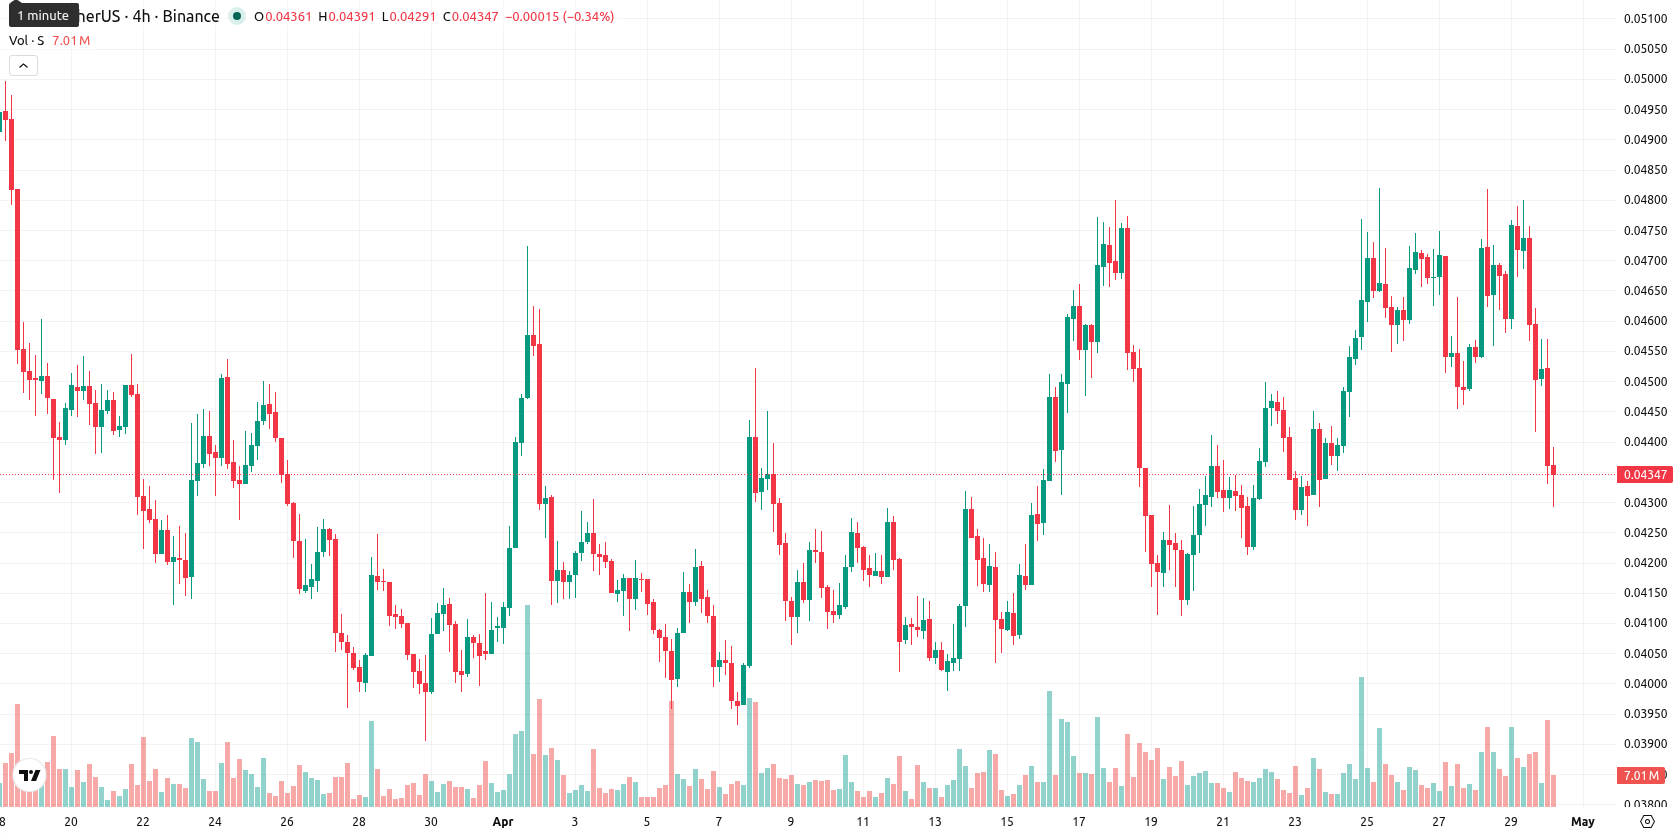
Sonic (S) is trading at $0.0435, down 8.05% on the day. The price currently sits just below its key short-term averages but remains well under its long-term mean.
Highlights
- Sonic trades below long-term averages and faces sustained bearish pressure, with sellers dominating recent intraday action.
- Technical indicators are mixed—some signal bullish momentum, but overall trend remains weak and conflicted.
- Expected trading range is $0.0420-$0.0455 over the next five days, with a higher probability of downward movement absent a break of resistance.
Long-term support challenged as short-term sellers outweigh bullish signals
Technically, S sits at $0.0435, just beneath the MA-20 ($0.0439), slightly above the MA-50 ($0.0434), and remains significantly below the MA-200 ($0.0806). The Ichimoku Kijun level on the daily chart is $0.0438, acting as immediate resistance, while support is seen near the intraday low at $0.0429. MACD currently issues a buy signal, but ADX remains subdued at 16.8, indicating weak trend strength. RSI reads 53, modestly bullish, while CCI is also in supportive buy territory. In contrast, Stoch RSI is neutral, and both intraday overbought and oversold readings point to high volatility. Bull/Bear Power (BBP) on D1 signals strong buying momentum; however, today’s pronounced move downward reveals a clash between longer-term supportive signals and current short-term seller dominance.
Sideways consolidation expected as volatility constrains breakout potential
Over the next five trading days, the expected price range for S is $0.0420 to $0.0455, a volatility band that aligns with recent price swings. The most probable scenario is a period of sideways consolidation just above the $0.0430 level. Should the price break above immediate resistance at $0.0438, a bullish reversal may develop. Alternatively, a move below $0.0420 could trigger further short-term losses.
Earlier, analysts noted that Sonic was under sustained selling pressure and lacked clear bullish momentum. The latest price action and indicator shifts now suggest a balanced tug-of-war between buyers and sellers, making a decisive break above $0.0438 or below $0.0420 the critical trigger for Sonic’s next directional move.


Latest Sonic News


-
 Afghanistan
-
 Albania
-
 Algeria
-
 Angola
-
 Argentina
-
 Armenia
-
 Australia
-
 Austria
-
 Azerbaijan
-
 Bahamas
-
 Bahrain
-
 Bangladesh
-
 Belarus
-
 Belgium
-
 Bolivia
-
 Botswana
-
 Brazil
-
 Brunei
-
 Bulgaria
-
 Cambodia
-
 Cameroon
-
 Canada
-
 Chile
Chile
-
 China
China
-
 Colombia
-
 Congo
Congo
-
 Costa Rica
-
 Cote d'Ivoire
-
 Croatia
-
 Cuba
Cuba
-
 Cyprus
-
 Czechia
-
 DR Congo
-
 Denmark
-
 Dominican Republic
-
 Ecuador
-
 Egypt
Egypt
-
 El Salvador
-
 Estonia
-
 Eswatini
-
 Ethiopia
-
 Finland
-
 France
-
 Georgia
-
 Germany
-
 Ghana
Ghana
-
 Greece
-
 Haiti
Haiti
-
 Hong Kong
-
 Hungary
-
 India
India
-
 Indonesia
-
 Iran, Islamic republic
-
 Iraq
Iraq
-
 Ireland
-
 Israel
-
 Italy
Italy
-
 Jamaica
-
 Japan
Japan
-
 Jordan
-
 Kazakhstan
-
 Kenya
Kenya
-
 Korea
Korea
-
 Kuwait
-
 Kyrgyzstan
-
 Laos
Laos
-
 Latvia
-
 Lebanon
-
 Lesotho
-
 Libya
Libya
-
 Lithuania
-
 Luxembourg
-
 Madagascar
-
 Malaysia
-
 Malta
Malta
-
 Mauritius
-
 Mexico
-
 Moldova
-
 Mongolia
-
 Montenegro
-
 Morocco
-
 Mozambique
-
 Myanmar
-
 Namibia
-
 Nepal
Nepal
-
 Netherlands
-
 New Zealand
-
 Nigeria
-
 North Macedonia
-
 Norway
-
 Oman
Oman
-
 Pakistan
-
 Palestine
-
 Panama
-
 Papua New Guinea
-
 Paraguay
-
 Peru
Peru
-
 Philippines
-
 Poland
-
 Portugal
-
 Puerto Rico
-
 Qatar
Qatar
-
 Reunion
-
 Romania
-
 Rwanda
-
 Saudi Arabia
-
 Serbia
-
 Singapore
-
 Slovakia
-
 Slovenia
-
 Somalia
-
 South Africa
-
 Spain
Spain
-
 Sri Lanka
-
 Sweden
-
 Switzerland
-
 Syria
Syria
-
 Taiwan
-
 Tajikistan
-
 Tanzania
-
 Thailand
-
 Trinidad and Tobago
-
 Tunisia
-
 Turkey
-
 UAE
UAE
-
 Uganda
-
 Ukraine
-
 United Kingdom
-
United States
-
 Uruguay
-
 Uzbekistan
-
 Venezuela
-
 Vietnam
-
 Yemen
Yemen
-
 Zambia
-
 Zimbabwe
- Forex
- Crypto
