
-7.88% for Celestia as short-term selling pressure sparks sharp intraday retreat

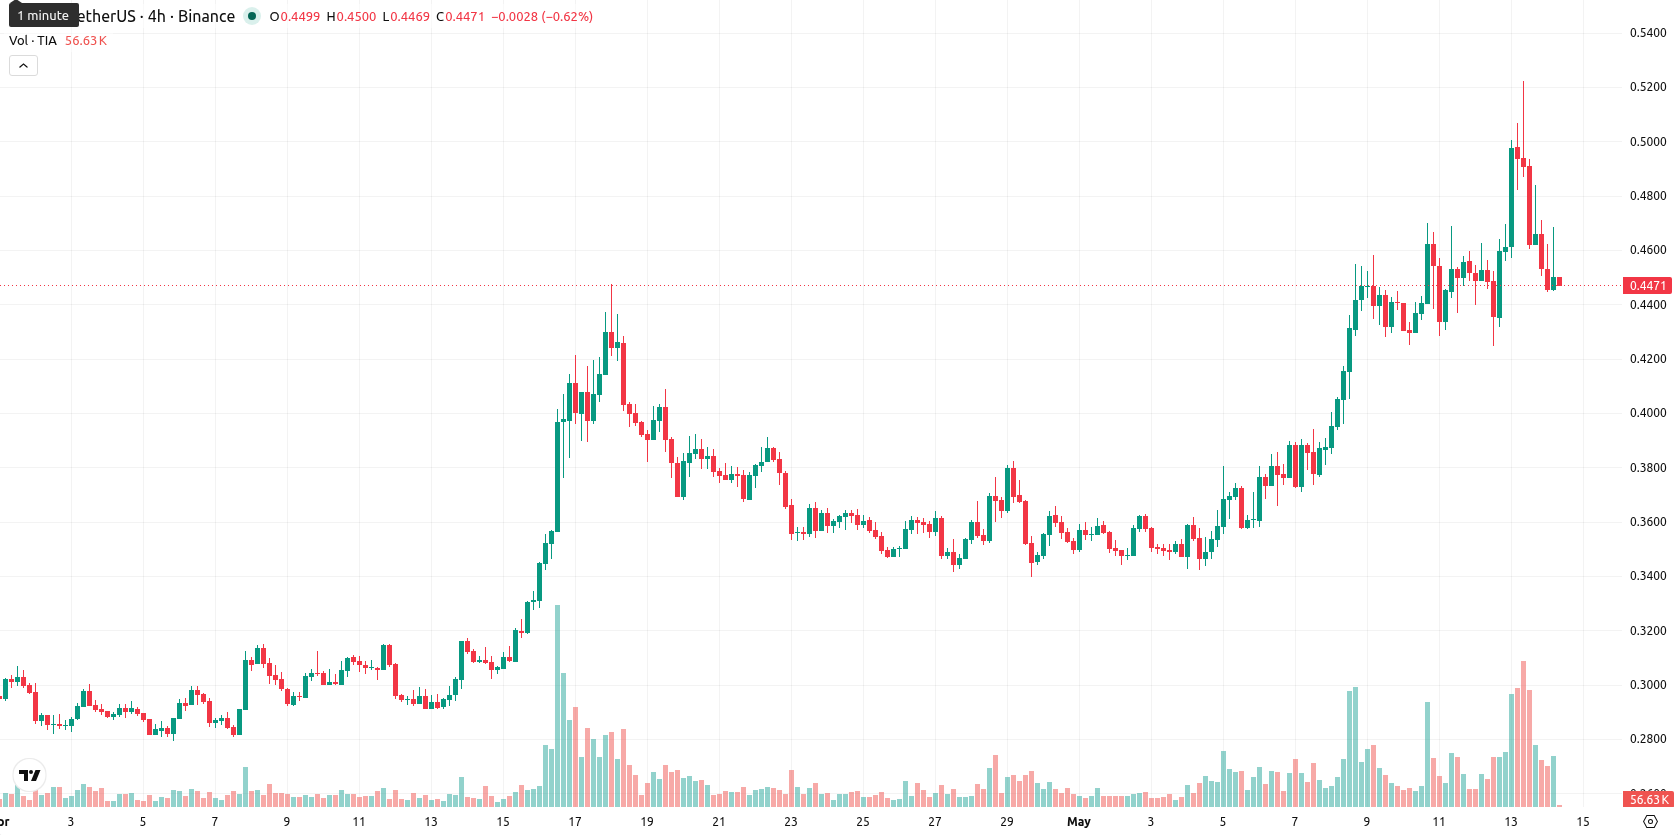
Celestia (TIA) is trading at $0.4522 after a daily decrease of 7.88%. The price remains above its key short- and medium-term moving averages, but longer-term resistance is still in place.
Highlights
- Celestia saw significantly higher trading activity and open interest, signaling rising engagement in both spot and derivatives markets.
- Improved liquidity allowed for more efficient trade execution and contributed to increased short-term price volatility, despite ongoing selling pressure.
- TIA remains volatile, trading near support at $0.43 with downside risk prevailing; expected five-day range is $0.44–$0.55 barring a decisive break.
Higher market participation fuels volatility amid breakout and selling pressure
Celestia recorded increased trading volume and open interest, reflecting higher participation in both spot and derivatives markets. This was accompanied by improved liquidity, which enabled more efficient execution and contributed to larger short-term price movements. The TIA token also broke a major descending resistance trendline in technical trading, though price action has remained under broader selling pressure.
Mixed momentum and overbought signals emerge as volatility surges
For TIA, the SMA-20 is at $0.3870 and the SMA-50 at $0.3492, while the SMA-200 stands higher at $0.4844, establishing an upper limit for current advances. The Ichimoku Kijun level of $0.4310 currently acts as immediate support beneath spot price. Momentum signals on the D1 chart are mixed: MACD favors further upside, and ADX points to a strengthening trend, yet RSI is at 70 and CCI is in overbought territory. Stoch RSI confirms an overbought condition, signaling the potential for a short-term pullback. BBP indicates session dominance by buyers, while the Awesome Oscillator shows persistent bullish underlying bias. Today's session saw a steep drop of 7.88% from a previous close of $0.4909, with TIA holding near the lower end of its daily range ($0.4451–$0.4683) and experiencing significant volatility immediately after the open.
Limited upside expected as resistance and volatility shape outlook
For the next five trading days, the expected price range is set at $0.4400–$0.5500, corresponding to a volatility band relative to current levels. The probability of further upside is considered very low (less than 20%) based on weekly timeframe readings. The baseline scenario projects consolidation above immediate support near $0.43. A bullish setup would require a move through $0.48 to open higher targets, while a break below $0.44 could trigger additional short-term declines.
Earlier, analysts noted that Celestia was exhibiting strong bullish momentum but remained vulnerable to possible corrective moves. The current environment adds greater volatility and mixed momentum signals, making sustained consolidation above immediate support at $0.43 the key scenario to watch in the coming sessions.


Latest Celestia News


-
 Afghanistan
-
 Albania
-
 Algeria
-
 Angola
-
 Argentina
-
 Armenia
-
 Australia
-
 Austria
-
 Azerbaijan
-
 Bahamas
-
 Bahrain
-
 Bangladesh
-
 Belarus
-
 Belgium
-
 Bolivia
-
 Botswana
-
 Brazil
-
 Brunei
-
 Bulgaria
-
 Cambodia
-
 Cameroon
-
 Canada
-
 Chile
Chile
-
 China
China
-
 Colombia
-
 Congo
Congo
-
 Costa Rica
-
 Cote d'Ivoire
-
 Croatia
-
 Cuba
Cuba
-
 Cyprus
-
 Czechia
-
 DR Congo
-
 Denmark
-
 Dominican Republic
-
 Ecuador
-
 Egypt
Egypt
-
 El Salvador
-
 Estonia
-
 Eswatini
-
 Ethiopia
-
 Finland
-
 France
-
 Georgia
-
 Germany
-
 Ghana
Ghana
-
 Greece
-
 Haiti
Haiti
-
 Hong Kong
-
 Hungary
-
 India
India
-
 Indonesia
-
 Iran, Islamic republic
-
 Iraq
Iraq
-
 Ireland
-
 Israel
-
 Italy
Italy
-
 Jamaica
-
 Japan
Japan
-
 Jordan
-
 Kazakhstan
-
 Kenya
Kenya
-
 Korea
Korea
-
 Kuwait
-
 Kyrgyzstan
-
 Laos
Laos
-
 Latvia
-
 Lebanon
-
 Lesotho
-
 Libya
Libya
-
 Lithuania
-
 Luxembourg
-
 Madagascar
-
 Malaysia
-
 Malta
Malta
-
 Mauritius
-
 Mexico
-
 Moldova
-
 Mongolia
-
 Montenegro
-
 Morocco
-
 Mozambique
-
 Myanmar
-
 Namibia
-
 Nepal
Nepal
-
 Netherlands
-
 New Zealand
-
 Nigeria
-
 North Macedonia
-
 Norway
-
 Oman
Oman
-
 Pakistan
-
 Palestine
-
 Panama
-
 Papua New Guinea
-
 Paraguay
-
 Peru
Peru
-
 Philippines
-
 Poland
-
 Portugal
-
 Puerto Rico
-
 Qatar
Qatar
-
 Reunion
-
 Romania
-
 Rwanda
-
 Saudi Arabia
-
 Serbia
-
 Singapore
-
 Slovakia
-
 Slovenia
-
 Somalia
-
 South Africa
-
 Spain
Spain
-
 Sri Lanka
-
 Sweden
-
 Switzerland
-
 Syria
Syria
-
 Taiwan
-
 Tajikistan
-
 Tanzania
-
 Thailand
-
 Trinidad and Tobago
-
 Tunisia
-
 Turkey
-
 UAE
UAE
-
 Uganda
-
 Ukraine
-
 United Kingdom
-
United States
-
 Uruguay
-
 Uzbekistan
-
 Venezuela
-
 Vietnam
-
 Yemen
Yemen
-
 Zambia
-
 Zimbabwe
- Forex
- Crypto
