
Sonic falls 7.47% as price remains far below long-term averages

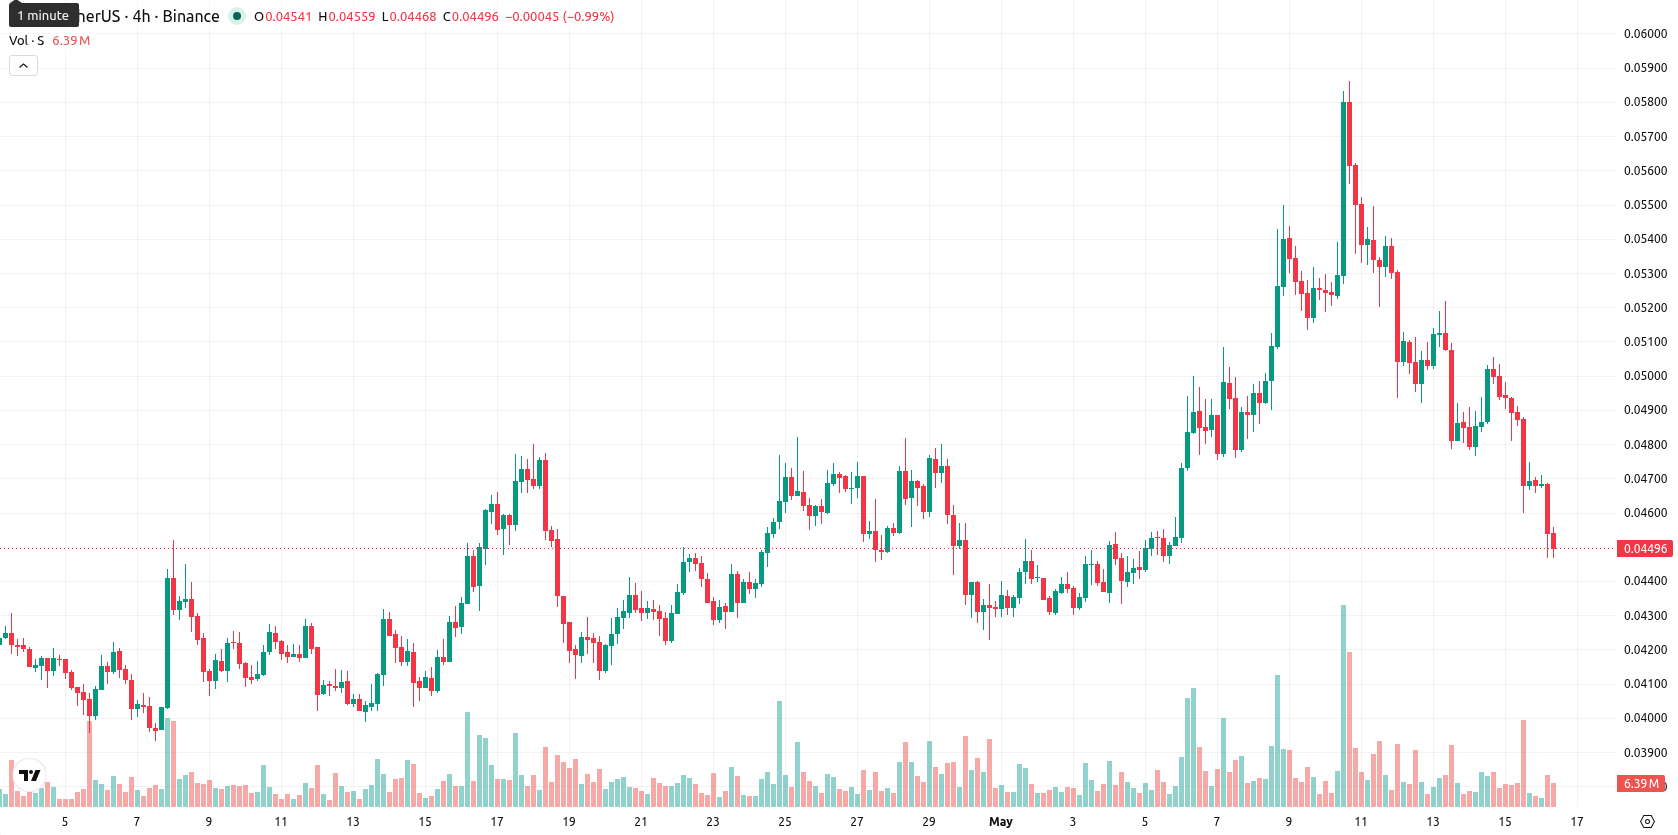
Sonic (S, formerly Fantom (FTM)) is trading at $0.0451, marking a daily decline of 7.47%. The asset currently sits below its key short-term averages and just above its medium-term moving average.
Highlights
- Sonic trades below key moving averages and faces strong resistance at $0.0500, indicating persistent bearish pressure short and long term.
- Momentum and oscillator signals are mixed, but sellers dominate intraday as the price drops 7.47% with high volatility.
- Sideways consolidation is likely near $0.0440–$0.0485; a move below $0.0440 could trigger renewed downside selling.
Technical indecision as buy signals clash with weak momentum
The current price of S is below the SMA-20 at $0.0478 and well below the SMA-200 at $0.0703, but is marginally above the SMA-50 at $0.0446. The Ichimoku Kijun level is at $0.0500, serving as immediate resistance. On momentum, MACD gives a strong buy signal while ADX only shows moderate trend strength. The RSI is just below neutral, indicating prevailing seller momentum, while Stoch RSI is in oversold territory, and CCI is neutral. BBP slightly favors buyers, but price is near the lower end of today's $0.0447–$0.0471 range, with intraday action dominated by sellers. The Awesome Oscillator does not currently indicate any supportive trend, and divergences between indicators signal ongoing indecision.
Limited rebound odds as downside risk drives outlook
Over the next five trading days, S is expected to fluctuate within a typical volatility band between $0.0440 and $0.0485. The likelihood of a price rebound is very low, with further downside more probable. The baseline scenario anticipates sideways consolidation near current prices. A close above the $0.0500 resistance could trigger bullish momentum, while a break below $0.0440 would likely bring in additional selling pressure and lower prices.
Earlier, analysts noted that Sonic was exhibiting short-term bullish momentum but faced key resistance and heightened selling pressure. Recent downside volatility now signals a shift in sentiment, with traders closely monitoring the $0.0440 support as a break below this level could accelerate losses in the coming sessions.


Latest Sonic News


-
 Afghanistan
-
 Albania
-
 Algeria
-
 Angola
-
 Argentina
-
 Armenia
-
 Australia
-
 Austria
-
 Azerbaijan
-
 Bahamas
-
 Bahrain
-
 Bangladesh
-
 Belarus
-
 Belgium
-
 Bolivia
-
 Botswana
-
 Brazil
-
 Brunei
-
 Bulgaria
-
 Cambodia
-
 Cameroon
-
 Canada
-
 Chile
Chile
-
 China
China
-
 Colombia
-
 Congo
Congo
-
 Costa Rica
-
 Cote d'Ivoire
-
 Croatia
-
 Cuba
Cuba
-
 Cyprus
-
 Czechia
-
 DR Congo
-
 Denmark
-
 Dominican Republic
-
 Ecuador
-
 Egypt
Egypt
-
 El Salvador
-
 Estonia
-
 Eswatini
-
 Ethiopia
-
 Finland
-
 France
-
 Georgia
-
 Germany
-
 Ghana
Ghana
-
 Greece
-
 Haiti
Haiti
-
 Hong Kong
-
 Hungary
-
 India
India
-
 Indonesia
-
 Iran, Islamic republic
-
 Iraq
Iraq
-
 Ireland
-
 Israel
-
 Italy
Italy
-
 Jamaica
-
 Japan
Japan
-
 Jordan
-
 Kazakhstan
-
 Kenya
Kenya
-
 Korea
Korea
-
 Kuwait
-
 Kyrgyzstan
-
 Laos
Laos
-
 Latvia
-
 Lebanon
-
 Lesotho
-
 Libya
Libya
-
 Lithuania
-
 Luxembourg
-
 Madagascar
-
 Malaysia
-
 Malta
Malta
-
 Mauritius
-
 Mexico
-
 Moldova
-
 Mongolia
-
 Montenegro
-
 Morocco
-
 Mozambique
-
 Myanmar
-
 Namibia
-
 Nepal
Nepal
-
 Netherlands
-
 New Zealand
-
 Nigeria
-
 North Macedonia
-
 Norway
-
 Oman
Oman
-
 Pakistan
-
 Palestine
-
 Panama
-
 Papua New Guinea
-
 Paraguay
-
 Peru
Peru
-
 Philippines
-
 Poland
-
 Portugal
-
 Puerto Rico
-
 Qatar
Qatar
-
 Reunion
-
 Romania
-
 Rwanda
-
 Saudi Arabia
-
 Serbia
-
 Singapore
-
 Slovakia
-
 Slovenia
-
 Somalia
-
 South Africa
-
 Spain
Spain
-
 Sri Lanka
-
 Sweden
-
 Switzerland
-
 Syria
Syria
-
 Taiwan
-
 Tajikistan
-
 Tanzania
-
 Thailand
-
 Trinidad and Tobago
-
 Tunisia
-
 Turkey
-
 UAE
UAE
-
 Uganda
-
 Ukraine
-
 United Kingdom
-
United States
-
 Uruguay
-
 Uzbekistan
-
 Venezuela
-
 Vietnam
-
 Yemen
Yemen
-
 Zambia
-
 Zimbabwe
- Forex
- Crypto
