
Sellers step back as oversold backdrop drags Pendle 8.44% lower

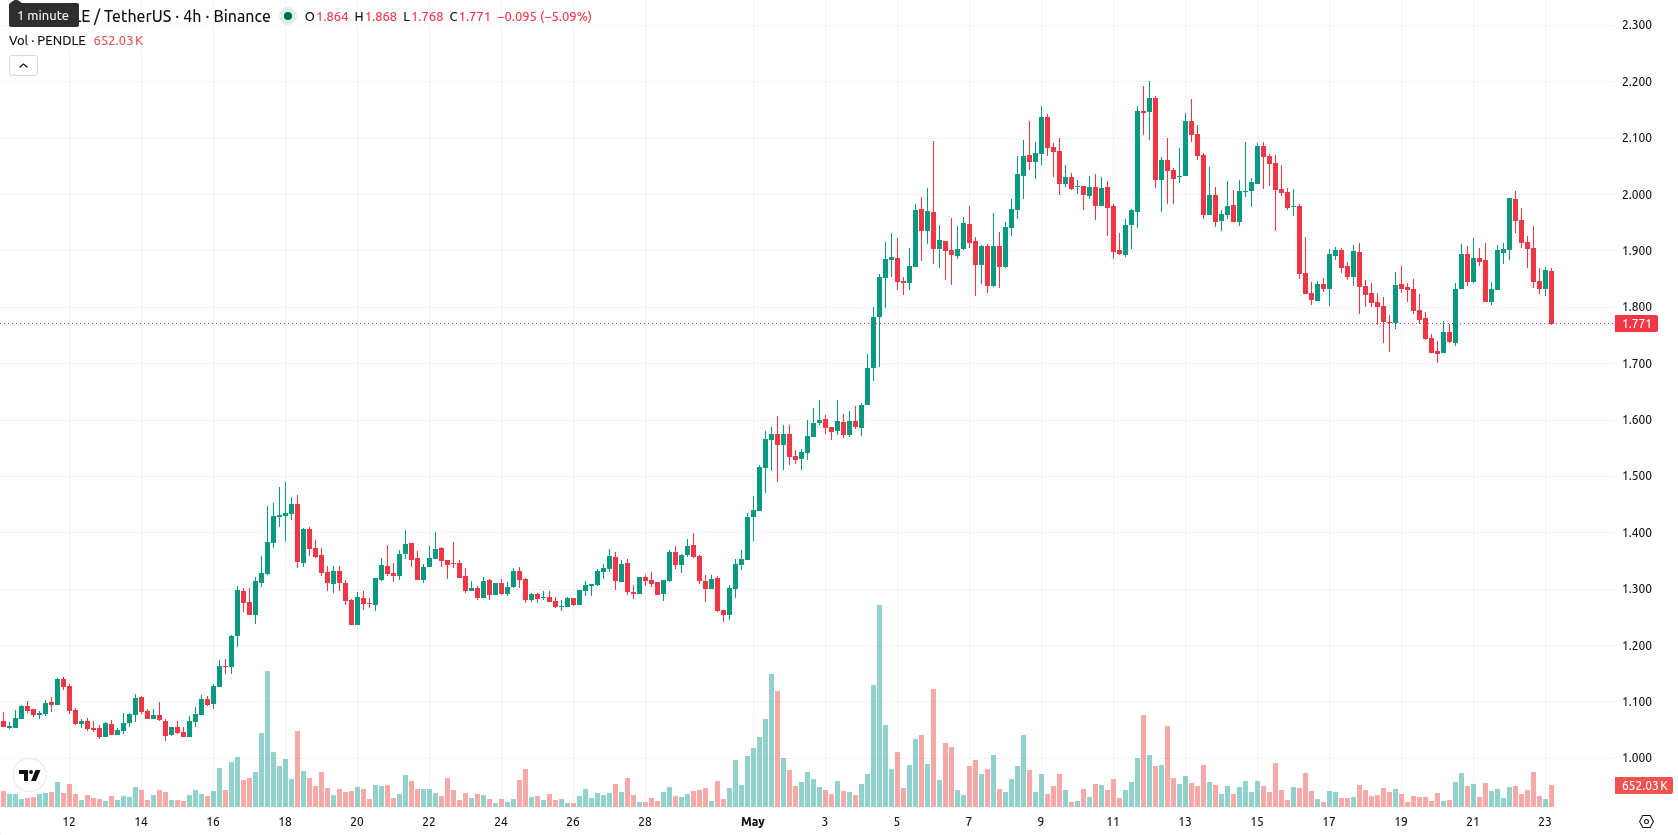
Pendle (PENDLE) is trading at $1.79, marking a daily decline of 8.44%. The price currently sits below its key short-term moving average, but remains above medium- and long-term averages.
Highlights
- PENDLE faces short-term selling pressure, trading below key short-term averages despite medium- and long-term trend support.
- Momentum and oscillator signals are mixed, reflecting high volatility and a cautious, slightly bullish underlying bias.
- Price is expected to consolidate between $1.73 and $2.02 over five days, with downside favored unless $2.02 is breached.
Technical boundaries tested as momentum signals diverge
Technically, PENDLE is trading below the MA-20 at $1.91, above the MA-50 at $1.50, and just over the MA-200 at $1.74. The Ichimoku Kijun level at $1.72 currently serves as immediate support. On the momentum side, MACD signals a strong buy while the daily ADX is robust at 39, reflecting a strong trend. The Stoch RSI is deeply oversold and CCI is neutral, indicating mixed market sentiment. RSI stands at 53.87, mildly bullish, whereas BBP reflects buyer dominance with a buy forecast. The Awesome Oscillator is neutral and does not signal a strong directional bias. The price has approached the day's intraday low of $1.81, confirming heavy volatility and lingering short-term pressure.
Limited upside as consolidation persists amid low bullish conviction
Over the next five trading days, PENDLE is expected to fluctuate within a volatility band between support at $1.73 and resistance near $2.02. With only one out of four daily and weekly indicators showing a bullish stance, the probability of a price increase remains under 20%. A base case scenario calls for continued consolidation between these levels; upward momentum could resume if the price can sustain a breakout above $2.02, whereas a breakdown below $1.73 would strengthen the likelihood of a bearish continuation.
Earlier, analysts noted that while Pendle was demonstrating buyer strength, mixed technical signals pointed to a potential period of sideways consolidation. The latest bout of volatility and a retreat below short-term averages add to the consolidation risk, making sustained moves above $2.02 or below $1.73 the key levels to watch for clear directional signals.


-
 Afghanistan
-
 Albania
-
 Algeria
-
 Angola
-
 Argentina
-
 Armenia
-
 Australia
-
 Austria
-
 Azerbaijan
-
 Bahamas
-
 Bahrain
-
 Bangladesh
-
 Belarus
-
 Belgium
-
 Bolivia
-
 Botswana
-
 Brazil
-
 Brunei
-
 Bulgaria
-
 Cambodia
-
 Cameroon
-
 Canada
-
 Chile
Chile
-
 China
China
-
 Colombia
-
 Congo
Congo
-
 Costa Rica
-
 Cote d'Ivoire
-
 Croatia
-
 Cuba
Cuba
-
 Cyprus
-
 Czechia
-
 DR Congo
-
 Denmark
-
 Dominican Republic
-
 Ecuador
-
 Egypt
Egypt
-
 El Salvador
-
 Estonia
-
 Eswatini
-
 Ethiopia
-
 Finland
-
 France
-
 Georgia
-
 Germany
-
 Ghana
Ghana
-
 Greece
-
 Haiti
Haiti
-
 Hong Kong
-
 Hungary
-
 India
India
-
 Indonesia
-
 Iran, Islamic republic
-
 Iraq
Iraq
-
 Ireland
-
 Israel
-
 Italy
Italy
-
 Jamaica
-
 Japan
Japan
-
 Jordan
-
 Kazakhstan
-
 Kenya
Kenya
-
 Korea
Korea
-
 Kuwait
-
 Kyrgyzstan
-
 Laos
Laos
-
 Latvia
-
 Lebanon
-
 Lesotho
-
 Libya
Libya
-
 Lithuania
-
 Luxembourg
-
 Madagascar
-
 Malaysia
-
 Malta
Malta
-
 Mauritius
-
 Mexico
-
 Moldova
-
 Mongolia
-
 Montenegro
-
 Morocco
-
 Mozambique
-
 Myanmar
-
 Namibia
-
 Nepal
Nepal
-
 Netherlands
-
 New Zealand
-
 Nigeria
-
 North Macedonia
-
 Norway
-
 Oman
Oman
-
 Pakistan
-
 Palestine
-
 Panama
-
 Papua New Guinea
-
 Paraguay
-
 Peru
Peru
-
 Philippines
-
 Poland
-
 Portugal
-
 Puerto Rico
-
 Qatar
Qatar
-
 Reunion
-
 Romania
-
 Rwanda
-
 Saudi Arabia
-
 Serbia
-
 Singapore
-
 Slovakia
-
 Slovenia
-
 Somalia
-
 South Africa
-
 Spain
Spain
-
 Sri Lanka
-
 Sweden
-
 Switzerland
-
 Syria
Syria
-
 Taiwan
-
 Tajikistan
-
 Tanzania
-
 Thailand
-
 Trinidad and Tobago
-
 Tunisia
-
 Turkey
-
 UAE
UAE
-
 Uganda
-
 Ukraine
-
 United Kingdom
-
United States
-
 Uruguay
-
 Uzbekistan
-
 Venezuela
-
 Vietnam
-
 Yemen
Yemen
-
 Zambia
-
 Zimbabwe
- Forex
- Crypto
