
Bitcoin price prediction: Can $64,046 support hold? BTC trades flat

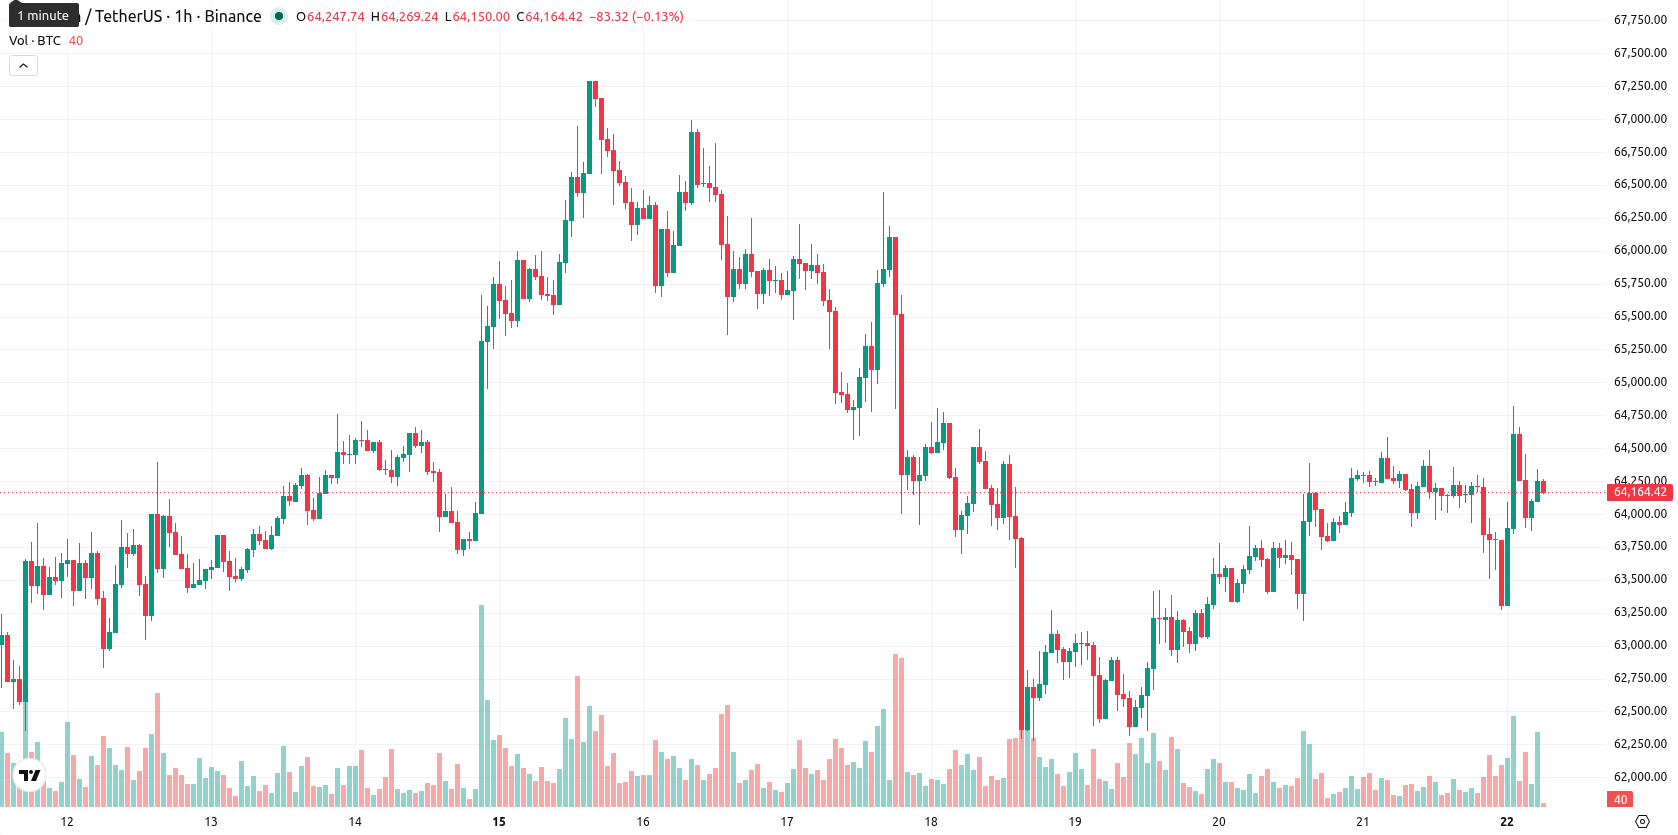
Bitcoin (BTC) is trading at $64,239, down 0.03% on the day. The asset remains above its key short- and medium-term moving averages but below longer-term trend benchmarks.
Highlights
- US spot Bitcoin ETFs experienced $6.35 billion in outflows over 30 days, signaling significant capital withdrawal and weakening market liquidity.
- Institutional participation and supply absorption declined amidst continued dominance by BlackRock's IBIT, which now controls 61% of US ETF Bitcoin assets.
- Technical indicators are mixed, with short-term bullish momentum in a $63,184–$65,294 range but long-term bearish pressure and high market indecision.
ETF outflows weigh on liquidity as institutional demand wanes
US spot Bitcoin ETFs have recorded $6.35 billion in outflows over the past 30 days, reflecting a substantial withdrawal of capital and dampening liquidity in the Bitcoin market, according to Captainaltcoin. This period saw institutional demand for Bitcoin decrease, further reducing major fund participation and supply absorption capacity. BlackRock's iShares Bitcoin Trust (IBIT) has maintained a dominant 61% share of the US spot Bitcoin ETF market with $47.95 billion in assets under management, based on Pluang data, though ETF flows have continued to pressure underlying sentiment.
Short-term technical signals diverge amid mixed momentum readings
Technical indicators show that BTC is positioned above its SMA-20 and SMA-50 on the H1 chart, while remaining below the SMA-200 on the daily timeframe. The Ichimoku Kijun support is identified at $64,046. On the momentum side, MACD is at a Strong Sell reading, whereas the Awesome Oscillator points to Strong Buy conditions. The Average Directional Index is Neutral, signaling unclear trend strength. RSI also points to a Sell near the midpoint, while both Stoch RSI and CCI remain Neutral, indicating a lack of overextended moves. BBP indicates Overbought conditions, signifying ongoing buyer presence despite mixed momentum signals.
Sideways bias prevails as breakout risks define near-term action
In the short term, BTC is expected to consolidate within the $63,184 to $65,294 price range over the next two to three trading days, reflecting typical volatility for the current environment. The up-move probability is estimated at 67%, while downward moves are less likely at 33%. The baseline scenario is sideways consolidation, with a bullish scenario triggered on a breakout above the upper band and a bearish scenario following any drop below the identified support.
Earlier, analysts noted that speculation surrounding Bitcoin’s origins is fueled by the enduring mystery of Satoshi Nakamoto’s identity, with unconventional theories persisting in the absence of definitive answers. In the current market context, traders should closely monitor consolidation behavior within the $63,184 to $65,294 range, as a breakout beyond these levels may provide crucial directional signals.


Latest Bitcoin News


-
 Afghanistan
-
 Albania
-
 Algeria
-
 Angola
-
 Argentina
-
 Armenia
-
 Australia
-
 Austria
-
 Azerbaijan
-
 Bahamas
-
 Bahrain
-
 Bangladesh
-
 Belarus
-
 Belgium
-
 Bolivia
-
 Botswana
-
 Brazil
-
 Brunei
-
 Bulgaria
-
 Cambodia
-
 Cameroon
-
 Canada
-
 Chile
Chile
-
 China
China
-
 Colombia
-
 Congo
Congo
-
 Costa Rica
-
 Cote d'Ivoire
-
 Croatia
-
 Cuba
Cuba
-
 Cyprus
-
 Czechia
-
 DR Congo
-
 Denmark
-
 Dominican Republic
-
 Ecuador
-
 Egypt
Egypt
-
 El Salvador
-
 Estonia
-
 Eswatini
-
 Ethiopia
-
 Finland
-
 France
-
 Georgia
-
 Germany
-
 Ghana
Ghana
-
 Greece
-
 Haiti
Haiti
-
 Hong Kong
-
 Hungary
-
 India
India
-
 Indonesia
-
 Iran, Islamic republic
-
 Iraq
Iraq
-
 Ireland
-
 Israel
-
 Italy
Italy
-
 Jamaica
-
 Japan
Japan
-
 Jordan
-
 Kazakhstan
-
 Kenya
Kenya
-
 Korea
Korea
-
 Kuwait
-
 Kyrgyzstan
-
 Laos
Laos
-
 Latvia
-
 Lebanon
-
 Lesotho
-
 Libya
Libya
-
 Lithuania
-
 Luxembourg
-
 Madagascar
-
 Malaysia
-
 Malta
Malta
-
 Mauritius
-
 Mexico
-
 Moldova
-
 Mongolia
-
 Montenegro
-
 Morocco
-
 Mozambique
-
 Myanmar
-
 Namibia
-
 Nepal
Nepal
-
 Netherlands
-
 New Zealand
-
 Nigeria
-
 North Macedonia
-
 Norway
-
 Oman
Oman
-
 Pakistan
-
 Palestine
-
 Panama
-
 Papua New Guinea
-
 Paraguay
-
 Peru
Peru
-
 Philippines
-
 Poland
-
 Portugal
-
 Puerto Rico
-
 Qatar
Qatar
-
 Reunion
-
 Romania
-
 Rwanda
-
 Saudi Arabia
-
 Serbia
-
 Singapore
-
 Slovakia
-
 Slovenia
-
 Somalia
-
 South Africa
-
 Spain
Spain
-
 Sri Lanka
-
 Sweden
-
 Switzerland
-
 Syria
Syria
-
 Taiwan
-
 Tajikistan
-
 Tanzania
-
 Thailand
-
 Trinidad and Tobago
-
 Tunisia
-
 Turkey
-
 UAE
UAE
-
 Uganda
-
 Ukraine
-
 United Kingdom
-
United States
-
 Uruguay
-
 Uzbekistan
-
 Venezuela
-
 Vietnam
-
 Yemen
Yemen
-
 Zambia
-
 Zimbabwe
- Forex
- Crypto
