

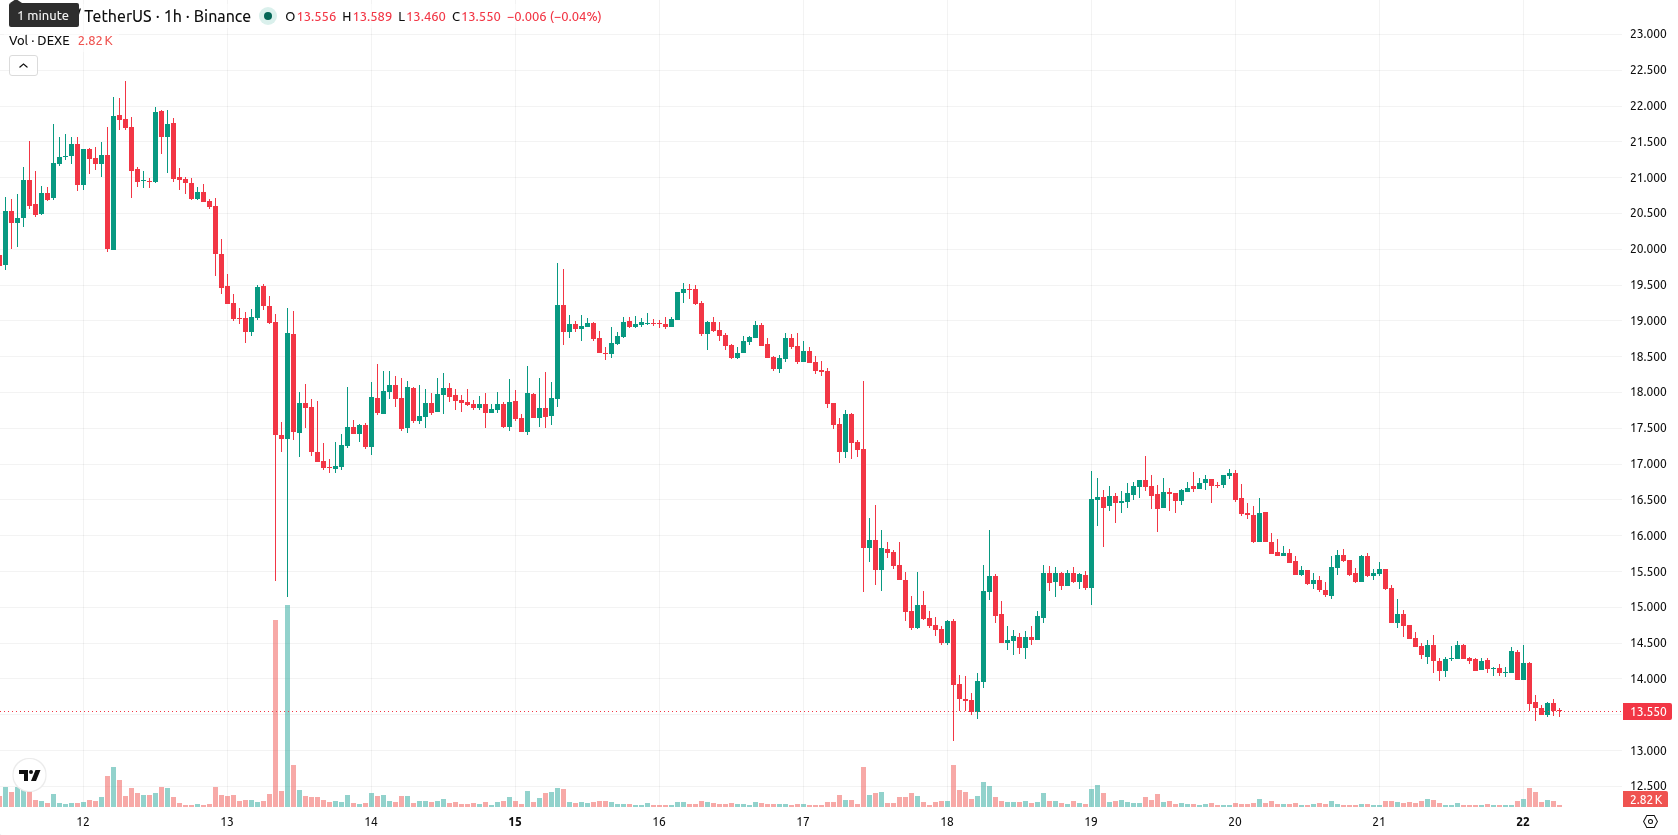
DeXe (DEXE) is trading at $13.55, recording a decline of 7.27% for the day. The asset is currently positioned below its key moving averages, indicating short-term weakness relative to its recent trends.
Highlights
- Price remains under short- and medium-term selling pressure, trading below key moving averages despite retaining a longer-term bullish structure.
- Momentum indicators confirm a pronounced bearish bias, with negative signals from MACD, ADX, RSI, and strong downside volatility.
- Over the next two to three days, price is likely to consolidate within a $12.12–$14.98 range, with a high probability of further downside.
Bearish momentum intensifies as support holds amid volatility
On the technical front, price is trading below the MA-20 ($14.06) and MA-50 ($14.8) on the hourly chart, but remains above the MA-200 ($7.86) on the daily timeframe. The Ichimoku Kijun level at $14.18 acts as immediate resistance. Support is identified near $12.12, while resistance is clustered at $14.18 and $14.98. Momentum indicators are negative: both MACD and ADX signal a sell bias, RSI is at 34.42 (sell), Stoch RSI is neutral, and CCI is in oversold territory. BBP continues to illustrate seller dominance in the current session, and the Awesome Oscillator confirms persistent bearish momentum, all coinciding with heavy intraday volatility near session lows.
Downside risk elevated as price consolidates within range
Over the next two to three trading days, DEXE is expected to trade in a range between $12.12 and $14.98, with the probability of further downside being high in the current volatility band. A sideways consolidation scenario may unfold within this range; a bullish case would require a breakout above the $14.18 resistance, while a confirmed break below $12.12 could open the way for additional declines.
Earlier, analysts noted that DeXe was experiencing sustained selling pressure amid broadly bearish technical momentum. The current session deepens this negative stance and traders should monitor the potential for further downside if price decisively breaks below the $12.12 support level.


-
 Afghanistan
-
 Albania
-
 Algeria
-
 Angola
-
 Argentina
-
 Armenia
-
 Australia
-
 Austria
-
 Azerbaijan
-
 Bahamas
-
 Bahrain
-
 Bangladesh
-
 Belarus
-
 Belgium
-
 Bolivia
-
 Botswana
-
 Brazil
-
 Brunei
-
 Bulgaria
-
 Cambodia
-
 Cameroon
-
 Canada
-
 Chile
Chile
-
 China
China
-
 Colombia
-
 Congo
Congo
-
 Costa Rica
-
 Cote d'Ivoire
-
 Croatia
-
 Cuba
Cuba
-
 Cyprus
-
 Czechia
-
 DR Congo
-
 Denmark
-
 Dominican Republic
-
 Ecuador
-
 Egypt
Egypt
-
 El Salvador
-
 Estonia
-
 Eswatini
-
 Ethiopia
-
 Finland
-
 France
-
 Georgia
-
 Germany
-
 Ghana
Ghana
-
 Greece
-
 Haiti
Haiti
-
 Hong Kong
-
 Hungary
-
 India
India
-
 Indonesia
-
 Iran, Islamic republic
-
 Iraq
Iraq
-
 Ireland
-
 Israel
-
 Italy
Italy
-
 Jamaica
-
 Japan
Japan
-
 Jordan
-
 Kazakhstan
-
 Kenya
Kenya
-
 Korea
Korea
-
 Kuwait
-
 Kyrgyzstan
-
 Laos
Laos
-
 Latvia
-
 Lebanon
-
 Lesotho
-
 Libya
Libya
-
 Lithuania
-
 Luxembourg
-
 Madagascar
-
 Malaysia
-
 Malta
Malta
-
 Mauritius
-
 Mexico
-
 Moldova
-
 Mongolia
-
 Montenegro
-
 Morocco
-
 Mozambique
-
 Myanmar
-
 Namibia
-
 Nepal
Nepal
-
 Netherlands
-
 New Zealand
-
 Nigeria
-
 North Macedonia
-
 Norway
-
 Oman
Oman
-
 Pakistan
-
 Palestine
-
 Panama
-
 Papua New Guinea
-
 Paraguay
-
 Peru
Peru
-
 Philippines
-
 Poland
-
 Portugal
-
 Puerto Rico
-
 Qatar
Qatar
-
 Reunion
-
 Romania
-
 Rwanda
-
 Saudi Arabia
-
 Serbia
-
 Singapore
-
 Slovakia
-
 Slovenia
-
 Somalia
-
 South Africa
-
 Spain
Spain
-
 Sri Lanka
-
 Sweden
-
 Switzerland
-
 Syria
Syria
-
 Taiwan
-
 Tajikistan
-
 Tanzania
-
 Thailand
-
 Trinidad and Tobago
-
 Tunisia
-
 Turkey
-
 UAE
UAE
-
 Uganda
-
 Ukraine
-
 United Kingdom
-
United States
-
 Uruguay
-
 Uzbekistan
-
 Venezuela
-
 Vietnam
-
 Yemen
Yemen
-
 Zambia
-
 Zimbabwe
- Forex
- Crypto
