
XRP remains under pressure as MACD and ADX reinforce the sell signal: weekly report

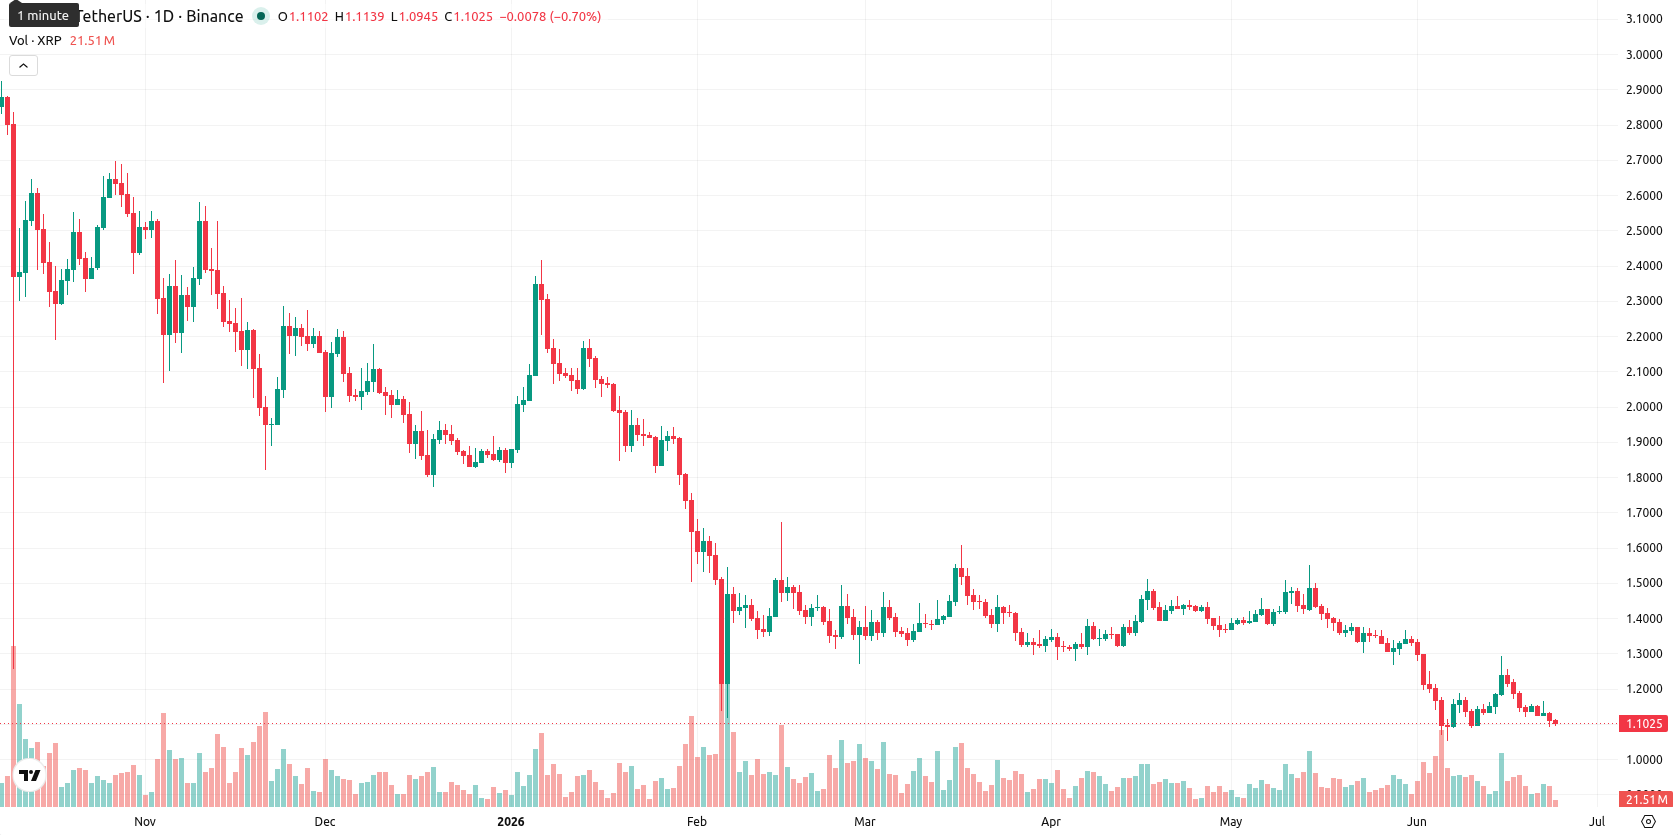
XRP is currently trading at $1.1025, ending the week with a decline of $0.0937, or 7.84%. The asset remains well below its weekly MA-20 ($1.3359), MA-50 ($2.0170), and MA-200 ($1.2014), underscoring sustained pressure from sellers and a weak position versus key moving averages.
Highlights
- XRP trades decisively below key moving averages, reflecting sustained medium- and long-term bearish pressure.
- Weekly momentum and oscillators confirm strong bearish signals, with oversold conditions indicating the downside may be nearing exhaustion.
- XRP is expected to range between $1.06 and $1.21 next week, with sub-20% odds for a price rebound and risk of further losses if support fails.
ETF inflows and regulatory gains shape market optimism despite supply shift
Spot XRP ETF inflows surpassed $1.35 billion over the past seven weeks, while exchange reserves reached a seven-year low, indicating a substantial shift of supply into ETFs and long-term wallets. Ripple continued to build regulatory momentum in Europe, supported by positive developments in the EU and ongoing discussions around U.S. digital asset legislation such as the CLARITY Act. Market participants are watching for further corporate actions, with continuing speculation regarding a potential Ripple IPO, though no official plans have been announced.
Bearish dominance intensifies as technicals flag momentum exhaustion this week
Weekly technicals highlight significant bearish dominance, with XRP far below all major moving averages on the W1 chart: MA-20 ($1.3359), MA-50 ($2.0170), and MA-200 ($1.2014). The Ichimoku Kijun remains far above, placing focus on MA-20 and MA-200 as principal dynamic resistances. Support is near $1.06, while resistance lies at $1.21. Momentum indicators remain negative, as MACD and Average Directional Index both reinforce the sell signal. RSI sits close to oversold, and Stochastic RSI and Commodity Channel Index are already oversold, signaling potential market exhaustion but no reversal yet. The Awesome Oscillator continues bearish, and Bull/Bear Power reflects maintained selling pressure.
Rangebound outlook prevails as weak rebound odds keep sellers in control
For the week ahead, XRP is likely to fluctuate between $1.06 and $1.21, capturing the recent pattern of about ±10% weekly volatility. The probability of a rebound remains low, with fewer than 20% of weekly indicators suggesting upward momentum, while seller control continues to dominate. The base scenario favors sideways action within the established range as bulls and bears reach a temporary stalemate. Should support at $1.06 break, further downside is possible; a sustained move above $1.21 would be needed for any renewed recovery.
Earlier, analysts noted that persistent bearish momentum in XRP was driven by strong selling pressure and diminishing liquidity on exchanges. This week's deepening oversold indicators and continued ETF-driven supply shifts reinforce the prevailing downside risk, making the $1.06 support level the critical threshold for traders as volatility persists.


Latest XRP News


-
 Afghanistan
-
 Albania
-
 Algeria
-
 Angola
-
 Argentina
-
 Armenia
-
 Australia
-
 Austria
-
 Azerbaijan
-
 Bahamas
-
 Bahrain
-
 Bangladesh
-
 Belarus
-
 Belgium
-
 Bolivia
-
 Botswana
-
 Brazil
-
 Brunei
-
 Bulgaria
-
 Cambodia
-
 Cameroon
-
 Canada
-
 Chile
Chile
-
 China
China
-
 Colombia
-
 Congo
Congo
-
 Costa Rica
-
 Cote d'Ivoire
-
 Croatia
-
 Cuba
Cuba
-
 Cyprus
-
 Czechia
-
 DR Congo
-
 Denmark
-
 Dominican Republic
-
 Ecuador
-
 Egypt
Egypt
-
 El Salvador
-
 Estonia
-
 Eswatini
-
 Ethiopia
-
 Finland
-
 France
-
 Georgia
-
 Germany
-
 Ghana
Ghana
-
 Greece
-
 Haiti
Haiti
-
 Hong Kong
-
 Hungary
-
 India
India
-
 Indonesia
-
 Iran, Islamic republic
-
 Iraq
Iraq
-
 Ireland
-
 Israel
-
 Italy
Italy
-
 Jamaica
-
 Japan
Japan
-
 Jordan
-
 Kazakhstan
-
 Kenya
Kenya
-
 Korea
Korea
-
 Kuwait
-
 Kyrgyzstan
-
 Laos
Laos
-
 Latvia
-
 Lebanon
-
 Lesotho
-
 Libya
Libya
-
 Lithuania
-
 Luxembourg
-
 Madagascar
-
 Malaysia
-
 Malta
Malta
-
 Mauritius
-
 Mexico
-
 Moldova
-
 Mongolia
-
 Montenegro
-
 Morocco
-
 Mozambique
-
 Myanmar
-
 Namibia
-
 Nepal
Nepal
-
 Netherlands
-
 New Zealand
-
 Nigeria
-
 North Macedonia
-
 Norway
-
 Oman
Oman
-
 Pakistan
-
 Palestine
-
 Panama
-
 Papua New Guinea
-
 Paraguay
-
 Peru
Peru
-
 Philippines
-
 Poland
-
 Portugal
-
 Puerto Rico
-
 Qatar
Qatar
-
 Reunion
-
 Romania
-
 Rwanda
-
 Saudi Arabia
-
 Serbia
-
 Singapore
-
 Slovakia
-
 Slovenia
-
 Somalia
-
 South Africa
-
 Spain
Spain
-
 Sri Lanka
-
 Sweden
-
 Switzerland
-
 Syria
Syria
-
 Taiwan
-
 Tajikistan
-
 Tanzania
-
 Thailand
-
 Trinidad and Tobago
-
 Tunisia
-
 Turkey
-
 UAE
UAE
-
 Uganda
-
 Ukraine
-
 United Kingdom
-
United States
-
 Uruguay
-
 Uzbekistan
-
 Venezuela
-
 Vietnam
-
 Yemen
Yemen
-
 Zambia
-
 Zimbabwe
- Forex
- Crypto
