
SHIB news: Bears dominate below key MAs — sellers hold intraday control

Shiba Inu (SHIB) is trading at 0.0000092, which is below the MA-20 (0.00000968), MA-50 (0.00001053), and MA-200 (0.00001242) on the daily chart. This structure signals persistent downward pressure across short-, medium-, and long-term trends, with the nearest dynamic support at 0.00000896 (HMA) and resistance at 0.00000953 (Ichimoku Kijun).
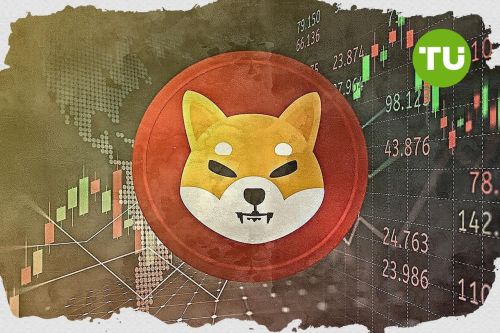
SHIB price prediction
Current price:
$ 0.0547
0
0.00%
Real-time Data
11:06
Daily range
0.0547
 0.0548
Weekly range
0.05463
0.05519
Loading...
Highlights
- Shiba Inu's market capitalization stands at $5.44 billion, underscoring its continued prominence in the wider crypto ecosystem.
- The launch of two regulated crypto index ETFs by 21Shares under the 1940 Act may influence investor sentiment and provide new liquidity to assets like SHIB.
- Trader interest is shifting toward tokens with utility, reflecting evolving market dynamics and a changing crypto narrative.
ETF launches and shifting utility focus reshape SHIB sentiment
Shiba Inu's market capitalization stands at $5.44 billion, reflecting its widespread presence within the crypto ecosystem. The launch of two regulated crypto index ETFs by 21Shares, governed under the 1940 Act, is poised to impact investor sentiment across the market and could potentially bring new liquidity to assets like SHIB. Meanwhile, trader interest is gradually shifting toward tokens with utility, which highlights changing dynamics in the crypto narrative.Bearish momentum persists amid conflicting oscillator signals
Momentum indicators show a bearish tilt: the MACD points to negative momentum and the ADX indicates a moderately strong trend. RSI at 39 and CCI at –96 suggest the market is edging toward oversold conditions, while Stoch RSI reads neutral on D1 but highlights mixed overbought/oversold signals across intraday timeframes. BBP points to intraday seller dominance. The Awesome Oscillator also confirms the prevailing downward pressure. SHIB marked a daily decline of 0.87% with a narrow gap between the previous close and today’s open, and the current price sits near the intraday high, indicating low volatility and slight pressure after the open. Overall, intraday dynamics align with waning momentum. However, conflicting oscillator signals point to indecision, underlining the lack of a clear reversal catalyst.Low upside probability as price consolidates within narrow range
For the next five trading days, the expected price range is 0.0000083 to 0.0000099, normalized to reflect SHIB’s recent volatility and avoid unrealistic extremes. The probability of a price increase is very low (less than 20%), making further downside the more likely scenario. The baseline outlook anticipates consolidation within a sideways corridor. In a bullish scenario, if SHIB breaks above resistance near 0.0000095, a test of the upper bound around 0.0000099 could follow. Conversely, a bearish scenario would see continuation below 0.0000086, potentially targeting fresh lows toward 0.0000083.
Anton Kharitonov, expert at Traders Union, sees Shiba Inu under clear technical pressure, with all key averages above current price. He notes the recent crypto ETF news may not be enough to lift sentiment as traders shift to utility-driven assets. Momentum and oscillator signals remain weak, supporting more downside or consolidation rather than a reversal. "Until SHIB reclaims resistance at $0.0000095, I remain defensive and see no reason to chase upside."
Previously it was noted that the asset exhibited weak momentum and indicators pointed to a prevailing bearish trend. Last time we reported that the expected range for the next 5 trading days was likely to be limited, reflecting a predominantly sideways or declining outlook.
Source of Data:
SHIB Price Analysis by TU
The analysis is based on a proprietary model combining technical, on-chain, and expert data. Not investment advice. See
methodology
The information is based on forecasts and does not constitute investment advice or a guarantee of future results. Market conditions may change. See our Disclaimer and Editorial Integrity for details.
Subscribe to TU news

Did you like the article?


Weekly Top Bonuses

Top News


Top 5 companies for you

United States
-
 Afghanistan
-
 Albania
-
 Algeria
-
 Angola
-
 Argentina
-
 Armenia
-
 Australia
-
 Austria
-
 Azerbaijan
-
 Bahamas
-
 Bahrain
-
 Bangladesh
-
 Belarus
-
 Belgium
-
 Bolivia
-
 Botswana
-
 Brazil
-
 Brunei
-
 Bulgaria
-
 Cambodia
-
 Cameroon
-
 Canada
-
 Chile
Chile
-
 China
China
-
 Colombia
-
 Congo
Congo
-
 Costa Rica
-
 Cote d'Ivoire
-
 Croatia
-
 Cuba
Cuba
-
 Cyprus
-
 Czechia
-
 DR Congo
-
 Denmark
-
 Dominican Republic
-
 Ecuador
-
 Egypt
Egypt
-
 El Salvador
-
 Estonia
-
 Eswatini
-
 Ethiopia
-
 Finland
-
 France
-
 Georgia
-
 Germany
-
 Ghana
Ghana
-
 Greece
-
 Haiti
Haiti
-
 Hong Kong
-
 Hungary
-
 India
India
-
 Indonesia
-
 Iran, Islamic republic
-
 Iraq
Iraq
-
 Ireland
-
 Israel
-
 Italy
Italy
-
 Jamaica
-
 Japan
Japan
-
 Jordan
-
 Kazakhstan
-
 Kenya
Kenya
-
 Korea
Korea
-
 Kuwait
-
 Kyrgyzstan
-
 Laos
Laos
-
 Latvia
-
 Lebanon
-
 Lesotho
-
 Libya
Libya
-
 Lithuania
-
 Luxembourg
-
 Madagascar
-
 Malaysia
-
 Malta
Malta
-
 Mauritius
-
 Mexico
-
 Moldova
-
 Mongolia
-
 Montenegro
-
 Morocco
-
 Mozambique
-
 Myanmar
-
 Namibia
-
 Nepal
Nepal
-
 Netherlands
-
 New Zealand
-
 Nigeria
-
 North Macedonia
-
 Norway
-
 Oman
Oman
-
 Pakistan
-
 Palestine
-
 Panama
-
 Papua New Guinea
-
 Paraguay
-
 Peru
Peru
-
 Philippines
-
 Poland
-
 Portugal
-
 Puerto Rico
-
 Qatar
Qatar
-
 Reunion
-
 Romania
-
 Rwanda
-
 Saudi Arabia
-
 Serbia
-
 Singapore
-
 Slovakia
-
 Slovenia
-
 Somalia
-
 South Africa
-
 Spain
Spain
-
 Sri Lanka
-
 Sweden
-
 Switzerland
-
 Syria
Syria
-
 Taiwan
-
 Tajikistan
-
 Tanzania
-
 Thailand
-
 Trinidad and Tobago
-
 Tunisia
-
 Turkey
-
 UAE
UAE
-
 Uganda
-
 Ukraine
-
 United Kingdom
-
United States
-
 Uruguay
-
 Uzbekistan
-
 Venezuela
-
 Vietnam
-
 Yemen
Yemen
-
 Zambia
-
 Zimbabwe
- Forex
- Crypto
Live News
