
Costco stock: bullish momentum and upbeat results trigger a 3.09% surge

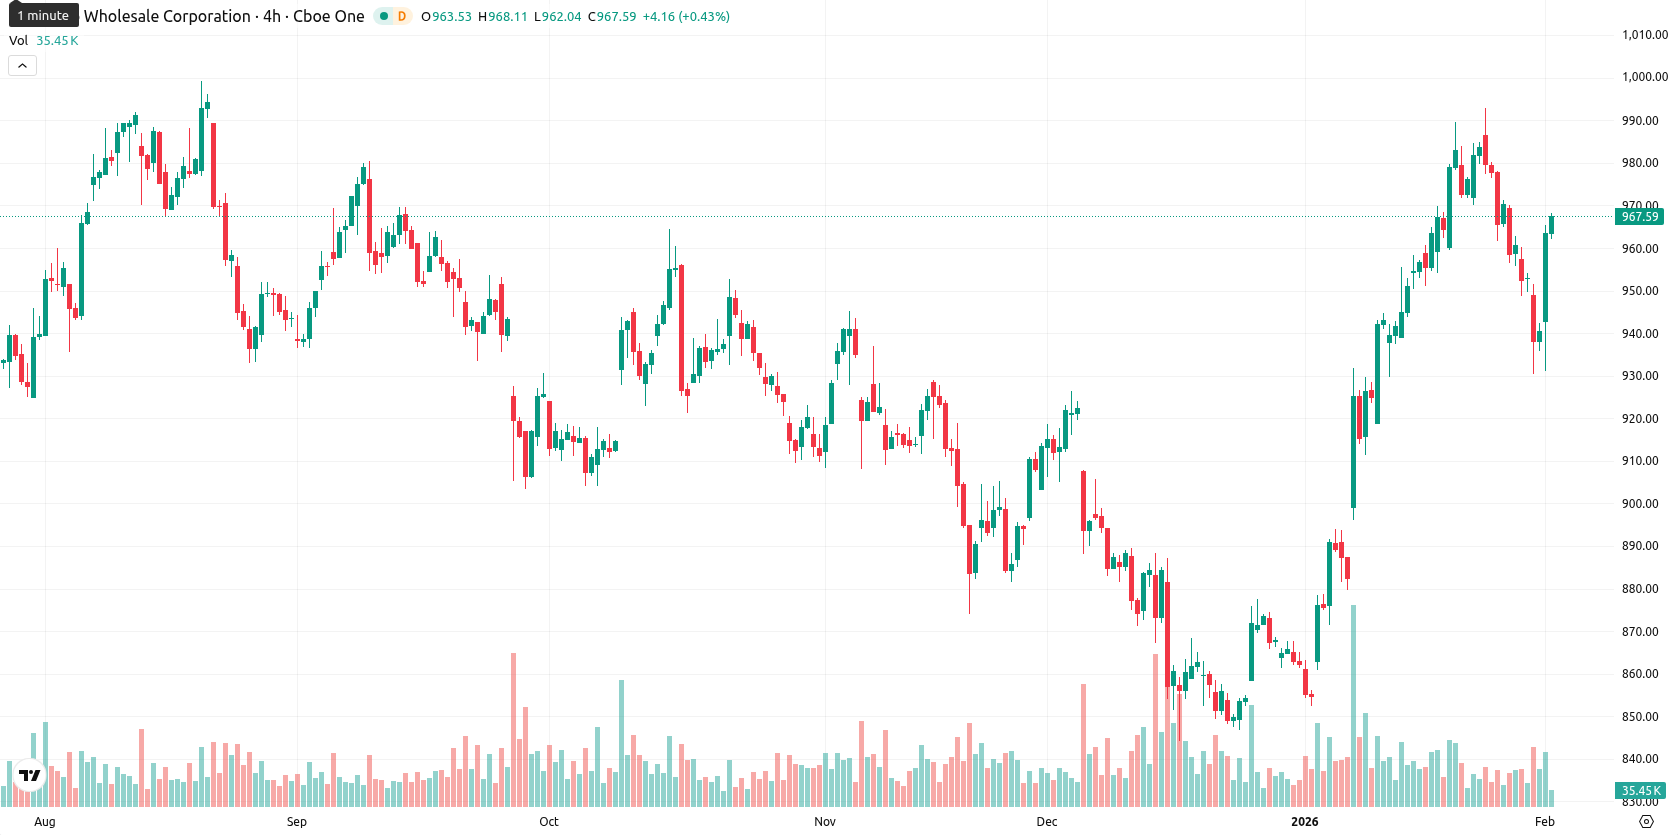
Costco Wholesale Corporation (COST) is trading at $969.49, well above its MA-20 ($940.41), MA-50 ($905.94), and MA-200 ($951.39) levels, indicating strong short-, medium-, and long-term bullish momentum.
Highlights
- Costco delivered an 8.3% year-over-year revenue increase and 6.4% same-store sales growth for fiscal Q1 2026, with EPS rising from $4.04 to $4.50.
- Digitally enabled sales surged 20.5%, while the company's Nike sneaker collaboration attracted high demand and triggered elevated resale prices following release.
- Costco shares are trading at $969.49, with bullish momentum well above key moving averages; resistance lies at $970–$975 and support around $950.
Earnings beat and Nike collaboration drive sales and sentiment higher
Costco reported an 8.3% year-over-year revenue increase and 6.4% growth in same-store sales for the fiscal first quarter of 2026. Earnings per share rose from $4.04 to $4.50 during the same period, while digitally enabled sales surged by 20.5%. The company also attracted high consumer interest with a surprise collaboration on Nike sneakers, which led to a spike in resale prices after the release.
Strong momentum clashes with mixed oscillator readings as resistance nears
The nearest dynamic support is given by the Ichimoku Kijun at $919.90, while resistance is likely around the psychological $970 – $975 zone due to proximity to recent highs. Momentum is robust on the daily chart, with both the MACD and ADX signaling continued buyer strength. The RSI is neutral to bullish at 52.46, while the Stochastic RSI and Bull/Bear Power both read as oversold, indicating recent buyer exhaustion amid overall elevated prices. The Commodity Channel Index is nearly flat, and the Awesome Oscillator does not strongly support the trend. The daily session opened with a minor gap up from $940.41 to $941.84, with the current price now near today's high ($969.36), reflecting high intraday volatility and pronounced strength towards the session highs. Divergence is notable between strong momentum and mixed-to-oversold oscillator readings, suggesting the bullish intraday move may be overextended in the very short term.
Moderately bullish outlook as volatility bands contain near-term risk
For the next five trading days, a typical volatility band is expected between $965 and $1,020. The probability of an upward move is more likely, while the probability of a decline is very low (less than 20%). The baseline scenario projects continued sideways movement within this corridor. A bullish scenario would see a breakout above $970 – $975, targeting the upper range near $1,020, while a bearish setup would require a sustained drop below $965, testing support towards the $950 area. Overall, the technical backdrop favors a moderately bullish outlook, with close monitoring of overbought signals and short-term exhaustion risk.
Previously it was reported that Costco Wholesale Corporation shares exhibit a strong bullish trend, trading firmly above all major weekly moving averages and supported by solid operational cash flows and disciplined capital allocation. Technical indicators, including weekly RSI and oscillators, point to ongoing upside potential with limited downside risk, while resistance near $970–$975 and support around $959 suggest a high probability of rangebound consolidation before any further advances.


-
 Afghanistan
-
 Albania
-
 Algeria
-
 Angola
-
 Argentina
-
 Armenia
-
 Australia
-
 Austria
-
 Azerbaijan
-
 Bahamas
-
 Bahrain
-
 Bangladesh
-
 Belarus
-
 Belgium
-
 Bolivia
-
 Botswana
-
 Brazil
-
 Brunei
-
 Bulgaria
-
 Cambodia
-
 Cameroon
-
 Canada
-
 Chile
Chile
-
 China
China
-
 Colombia
-
 Congo
Congo
-
 Costa Rica
-
 Cote d'Ivoire
-
 Croatia
-
 Cuba
Cuba
-
 Cyprus
-
 Czechia
-
 DR Congo
-
 Denmark
-
 Dominican Republic
-
 Ecuador
-
 Egypt
Egypt
-
 El Salvador
-
 Estonia
-
 Eswatini
-
 Ethiopia
-
 Finland
-
 France
-
 Georgia
-
 Germany
-
 Ghana
Ghana
-
 Greece
-
 Haiti
Haiti
-
 Hong Kong
-
 Hungary
-
 India
India
-
 Indonesia
-
 Iran, Islamic republic
-
 Iraq
Iraq
-
 Ireland
-
 Israel
-
 Italy
Italy
-
 Jamaica
-
 Japan
Japan
-
 Jordan
-
 Kazakhstan
-
 Kenya
Kenya
-
 Korea
Korea
-
 Kuwait
-
 Kyrgyzstan
-
 Laos
Laos
-
 Latvia
-
 Lebanon
-
 Lesotho
-
 Libya
Libya
-
 Lithuania
-
 Luxembourg
-
 Madagascar
-
 Malaysia
-
 Malta
Malta
-
 Mauritius
-
 Mexico
-
 Moldova
-
 Mongolia
-
 Montenegro
-
 Morocco
-
 Mozambique
-
 Myanmar
-
 Namibia
-
 Nepal
Nepal
-
 Netherlands
-
 New Zealand
-
 Nigeria
-
 North Macedonia
-
 Norway
-
 Oman
Oman
-
 Pakistan
-
 Palestine
-
 Panama
-
 Papua New Guinea
-
 Paraguay
-
 Peru
Peru
-
 Philippines
-
 Poland
-
 Portugal
-
 Puerto Rico
-
 Qatar
Qatar
-
 Reunion
-
 Romania
-
 Rwanda
-
 Saudi Arabia
-
 Serbia
-
 Singapore
-
 Slovakia
-
 Slovenia
-
 Somalia
-
 South Africa
-
 Spain
Spain
-
 Sri Lanka
-
 Sweden
-
 Switzerland
-
 Syria
Syria
-
 Taiwan
-
 Tajikistan
-
 Tanzania
-
 Thailand
-
 Trinidad and Tobago
-
 Tunisia
-
 Turkey
-
 UAE
UAE
-
 Uganda
-
 Ukraine
-
 United Kingdom
-
United States
-
 Uruguay
-
 Uzbekistan
-
 Venezuela
-
 Vietnam
-
 Yemen
Yemen
-
 Zambia
-
 Zimbabwe
- Forex
- Crypto
