
COST weekly review: price consolidates near highs — upside potential if $1,000 is cleared

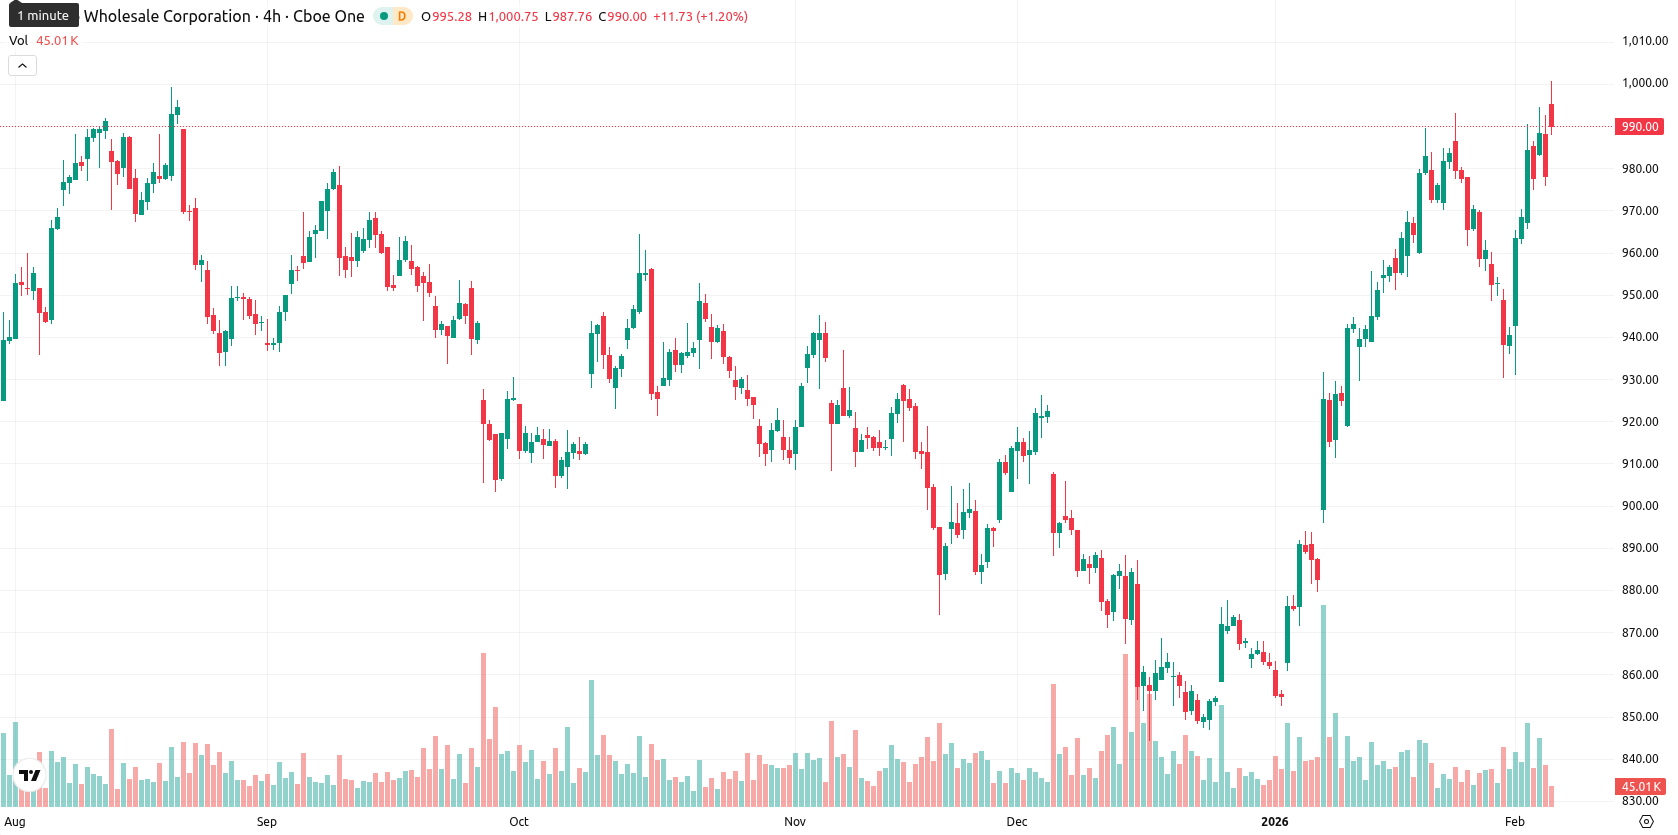
Costco Wholesale Corporation (COST) is trading at $988.33, marking a weekly gain and positioning itself well above its key moving averages: MA-20 at $955.67, MA-50 at $910.85, and MA-200 at $951.31. This robust bullish alignment on the weekly chart highlights strong upward momentum relative to recent history.
Highlights
- Costco (COST) trades at $988.33, firmly above MA-20 ($955.67), MA-50 ($910.85), and MA-200 ($951.31), confirming a sustained bullish trend across all timeframes.
- Momentum indicators including MACD, ADX, and RSI (64.40) support continued buying strength, with no strong overbought warnings, though some short-term oscillators signal mild stretch.
- Near-term resistance is at $1,000, with dynamic support at $923.62 and an 80%+ probability of price consolidating or moving higher within the $985–$1,035 range over five sessions.
Earnings growth and rising investor interest fuel positive sentiment this week
Costco reported net sales of $21.33 billion for January 2026, a 9.3% increase year over year, alongside 7.1% growth in comparable sales driven by e-commerce and broad geographic strength. The company also declared a quarterly cash dividend of $1.30 per share, scheduled for payment in February 2026, following 22-week net sales of $123.16 billion, up 8.5%. Institutional investors have increased their holdings recently, and the stock has outpaced the market thus far in 2026.
Sustained bullish momentum as technicals reinforce upward bias on the week
Weekly technicals remain firmly positive, with COST trading significantly above its MA-20, MA-50, and MA-200, reinforcing a strong bullish trend across short-, medium-, and long-term horizons on the weekly timeframe. The nearest dynamic support is the Ichimoku Kijun at $923.62, while key weekly resistance is near the $1,000 round number. Momentum remains in buyers' favor: the weekly RSI stands at 64.40 and the weekly CCI at 99.54, both pointing to continued upward pressure without flashing overbought signals, while strong weekly MACD and ADX support sustained bullish bias.
Bullish continuation favored unless $1,000 breaks on increased upside risk
Over the next five to seven sessions, COST is expected to trade within a range of $985 to $1,035, with more than an 80% probability favoring a continuation of the bullish move. The baseline scenario sees price consolidating above $985, with sustained gains possible if COST breaks and holds above the $1,000 resistance, potentially targeting $1,035. Downside risk appears limited, but a break below $985 could trigger modest profit-taking and a move toward key dynamic supports. Overall, weekly data points to ongoing buyer control and a constructive outlook in the near term.
Last time, analysts noted that Costco is exhibiting strong bullish momentum, trading above key moving averages with robust earnings and positive sentiment driving the trend. However, while momentum indicators remain supportive, mixed oscillator readings and overbought signals near $970–$975 resistance suggest possible short-term exhaustion, with risk contained by nearby volatility bands and dynamic support.


-
 Afghanistan
-
 Albania
-
 Algeria
-
 Angola
-
 Argentina
-
 Armenia
-
 Australia
-
 Austria
-
 Azerbaijan
-
 Bahamas
-
 Bahrain
-
 Bangladesh
-
 Belarus
-
 Belgium
-
 Bolivia
-
 Botswana
-
 Brazil
-
 Brunei
-
 Bulgaria
-
 Cambodia
-
 Cameroon
-
 Canada
-
 Chile
Chile
-
 China
China
-
 Colombia
-
 Congo
Congo
-
 Costa Rica
-
 Cote d'Ivoire
-
 Croatia
-
 Cuba
Cuba
-
 Cyprus
-
 Czechia
-
 DR Congo
-
 Denmark
-
 Dominican Republic
-
 Ecuador
-
 Egypt
Egypt
-
 El Salvador
-
 Estonia
-
 Eswatini
-
 Ethiopia
-
 Finland
-
 France
-
 Georgia
-
 Germany
-
 Ghana
Ghana
-
 Greece
-
 Haiti
Haiti
-
 Hong Kong
-
 Hungary
-
 India
India
-
 Indonesia
-
 Iran, Islamic republic
-
 Iraq
Iraq
-
 Ireland
-
 Israel
-
 Italy
Italy
-
 Jamaica
-
 Japan
Japan
-
 Jordan
-
 Kazakhstan
-
 Kenya
Kenya
-
 Korea
Korea
-
 Kuwait
-
 Kyrgyzstan
-
 Laos
Laos
-
 Latvia
-
 Lebanon
-
 Lesotho
-
 Libya
Libya
-
 Lithuania
-
 Luxembourg
-
 Madagascar
-
 Malaysia
-
 Malta
Malta
-
 Mauritius
-
 Mexico
-
 Moldova
-
 Mongolia
-
 Montenegro
-
 Morocco
-
 Mozambique
-
 Myanmar
-
 Namibia
-
 Nepal
Nepal
-
 Netherlands
-
 New Zealand
-
 Nigeria
-
 North Macedonia
-
 Norway
-
 Oman
Oman
-
 Pakistan
-
 Palestine
-
 Panama
-
 Papua New Guinea
-
 Paraguay
-
 Peru
Peru
-
 Philippines
-
 Poland
-
 Portugal
-
 Puerto Rico
-
 Qatar
Qatar
-
 Reunion
-
 Romania
-
 Rwanda
-
 Saudi Arabia
-
 Serbia
-
 Singapore
-
 Slovakia
-
 Slovenia
-
 Somalia
-
 South Africa
-
 Spain
Spain
-
 Sri Lanka
-
 Sweden
-
 Switzerland
-
 Syria
Syria
-
 Taiwan
-
 Tajikistan
-
 Tanzania
-
 Thailand
-
 Trinidad and Tobago
-
 Tunisia
-
 Turkey
-
 UAE
UAE
-
 Uganda
-
 Ukraine
-
 United Kingdom
-
United States
-
 Uruguay
-
 Uzbekistan
-
 Venezuela
-
 Vietnam
-
 Yemen
Yemen
-
 Zambia
-
 Zimbabwe
- Forex
- Crypto
