
Globalstar stock rises 4.97% as oversold signals contrast with strong intraday momentum

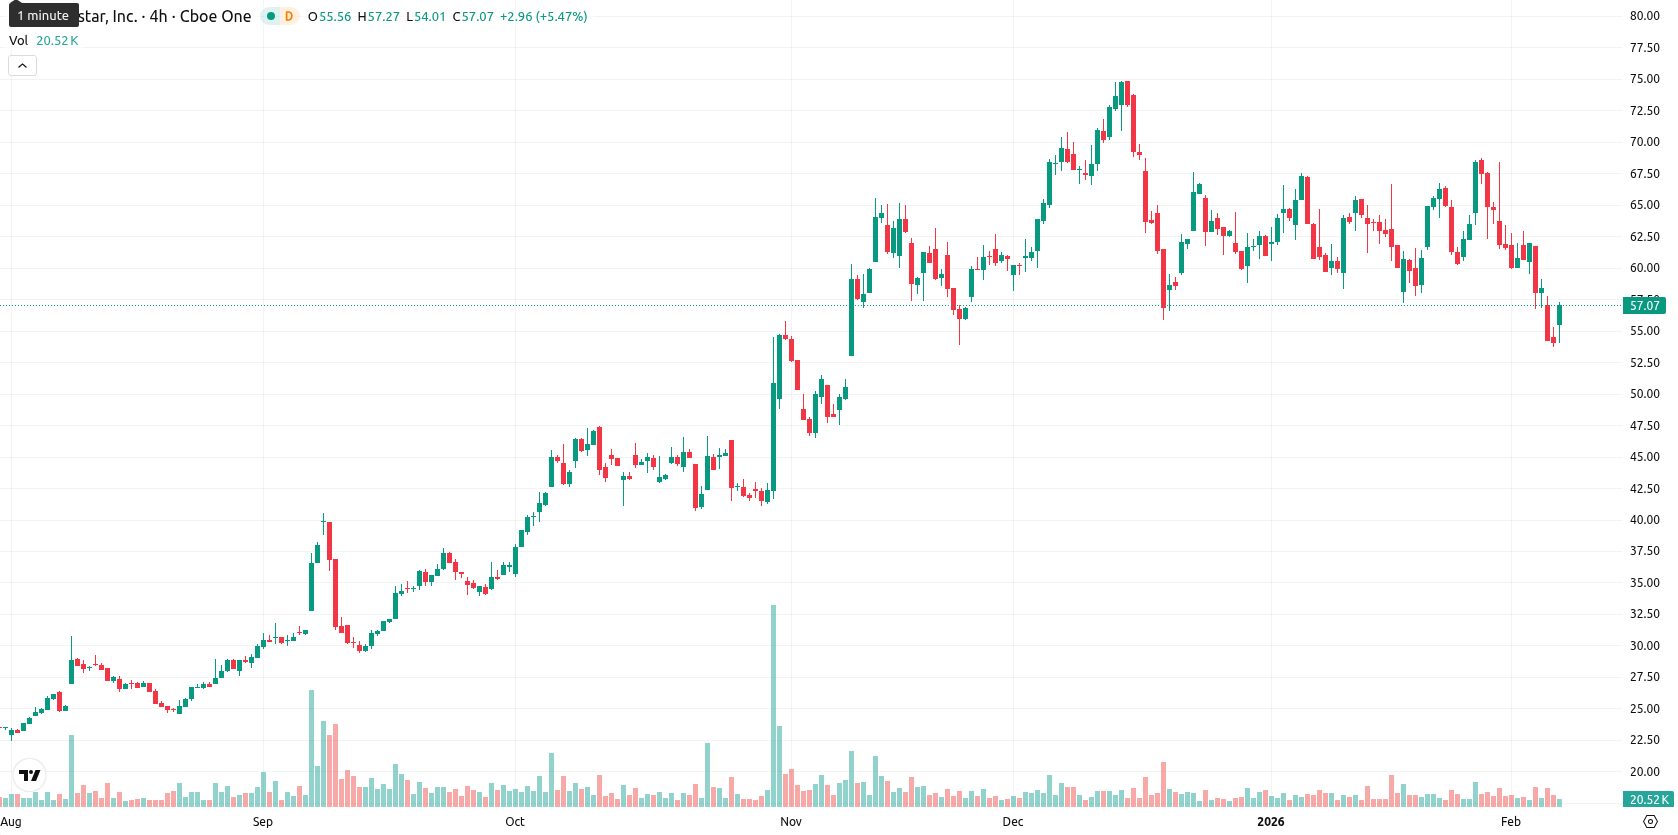
Globalstar, Inc. (GSAT) is trading at $56.82, below its MA-20 ($61.93) and MA-50 ($63.27), but well above the MA-200 ($39.20), indicating lingering medium-term bearish pressure despite longer-term support. The Ichimoku Kijun level at $61.24 acts as the nearest dynamic resistance, while the MA-200 remains the major long-term support zone.
Highlights
- Globalstar partnered with Boingo Wireless to deploy XCOM RAN technology, targeting private 5G network growth and expansion into data-intensive markets.
- Penserra Capital Management LLC reduced its Globalstar holdings by 9.8% in Q3, selling 47,483 shares per latest SEC filing.
- GSAT trades at $56.82, below short-term resistances (MA-20 $61.93, Kijun $61.24), with probable range $54.00–$58.50 and a strong upside probability exceeding 80%.
Portfolio reduction and tech partnership reshape revenue outlook
Globalstar reduced its holdings by 9.8% in the third quarter, with Penserra Capital Management LLC selling 47,483 shares according to the latest SEC filing. The company announced a partnership with Boingo Wireless to deploy Globalstar's XCOM RAN technology, advancing private 5G network initiatives and expanding its presence in data-intensive sectors. Additionally, Globalstar is upgrading its ground infrastructure to support higher data traffic and focusing on specialized infrastructure and wholesale capacity sales to diversify revenue streams.
Volatility surge contrasts with weak momentum and oversold signals
Momentum signals are mixed for GSAT: the MACD suggests a bearish daily bias, and while the ADX points to weak trend strength on the daily chart, there is strong movement over longer periods. Oversold signals from the RSI, Stochastic RSI, CCI, and negative Bull/Bear Power all indicate that sellers are dominating intraday action, despite today's strong upside move. The price opened with a small gap higher and surged nearly 5% to the upper end of the day's range, signaling high volatility and pronounced strength toward the highs, but this stands in contrast to subdued momentum readings, underscoring a clear divergence.
Price consolidation expected as technicals and volatility diverge
Over the next five trading days, GSAT is expected to remain in a typical volatility band between $54.00 and $58.50, with more than an 80% probability of a price increase and a lower chance of a reversal. The baseline scenario calls for price consolidation between support and resistance as technicals remain mixed and oversold. Bullish momentum could return if GSAT breaks above the $61.20 resistance (Ichimoku Kijun), opening the way toward $63.00 – $64.00 if momentum improves. Conversely, a drop below $54.00 would expose $51.00 – $50.00, although oversold oscillators and strong weekly trend make a sustained downside less likely.
Previously it was reported that Globalstar, Inc. is trading below its short- and medium-term moving averages but remains well above its long-term trend line, reflecting ongoing short-term selling pressure amid a supportive long-term backdrop. Technical indicators show oversold conditions and weak momentum, with key resistance near $61 and support around $54, suggesting the asset may stay range-bound in the near term as investors watch for signs of a potential rebound.


Latest Globalstar News


-
 Afghanistan
-
 Albania
-
 Algeria
-
 Angola
-
 Argentina
-
 Armenia
-
 Australia
-
 Austria
-
 Azerbaijan
-
 Bahamas
-
 Bahrain
-
 Bangladesh
-
 Belarus
-
 Belgium
-
 Bolivia
-
 Botswana
-
 Brazil
-
 Brunei
-
 Bulgaria
-
 Cambodia
-
 Cameroon
-
 Canada
-
 Chile
Chile
-
 China
China
-
 Colombia
-
 Congo
Congo
-
 Costa Rica
-
 Cote d'Ivoire
-
 Croatia
-
 Cuba
Cuba
-
 Cyprus
-
 Czechia
-
 DR Congo
-
 Denmark
-
 Dominican Republic
-
 Ecuador
-
 Egypt
Egypt
-
 El Salvador
-
 Estonia
-
 Eswatini
-
 Ethiopia
-
 Finland
-
 France
-
 Georgia
-
 Germany
-
 Ghana
Ghana
-
 Greece
-
 Haiti
Haiti
-
 Hong Kong
-
 Hungary
-
 India
India
-
 Indonesia
-
 Iran, Islamic republic
-
 Iraq
Iraq
-
 Ireland
-
 Israel
-
 Italy
Italy
-
 Jamaica
-
 Japan
Japan
-
 Jordan
-
 Kazakhstan
-
 Kenya
Kenya
-
 Korea
Korea
-
 Kuwait
-
 Kyrgyzstan
-
 Laos
Laos
-
 Latvia
-
 Lebanon
-
 Lesotho
-
 Libya
Libya
-
 Lithuania
-
 Luxembourg
-
 Madagascar
-
 Malaysia
-
 Malta
Malta
-
 Mauritius
-
 Mexico
-
 Moldova
-
 Mongolia
-
 Montenegro
-
 Morocco
-
 Mozambique
-
 Myanmar
-
 Namibia
-
 Nepal
Nepal
-
 Netherlands
-
 New Zealand
-
 Nigeria
-
 North Macedonia
-
 Norway
-
 Oman
Oman
-
 Pakistan
-
 Palestine
-
 Panama
-
 Papua New Guinea
-
 Paraguay
-
 Peru
Peru
-
 Philippines
-
 Poland
-
 Portugal
-
 Puerto Rico
-
 Qatar
Qatar
-
 Reunion
-
 Romania
-
 Rwanda
-
 Saudi Arabia
-
 Serbia
-
 Singapore
-
 Slovakia
-
 Slovenia
-
 Somalia
-
 South Africa
-
 Spain
Spain
-
 Sri Lanka
-
 Sweden
-
 Switzerland
-
 Syria
Syria
-
 Taiwan
-
 Tajikistan
-
 Tanzania
-
 Thailand
-
 Trinidad and Tobago
-
 Tunisia
-
 Turkey
-
 UAE
UAE
-
 Uganda
-
 Ukraine
-
 United Kingdom
-
United States
-
 Uruguay
-
 Uzbekistan
-
 Venezuela
-
 Vietnam
-
 Yemen
Yemen
-
 Zambia
-
 Zimbabwe
- Forex
- Crypto
