
Globalstar stock climbs 3.42% as traders anticipate steady Q4 results and upside breakout

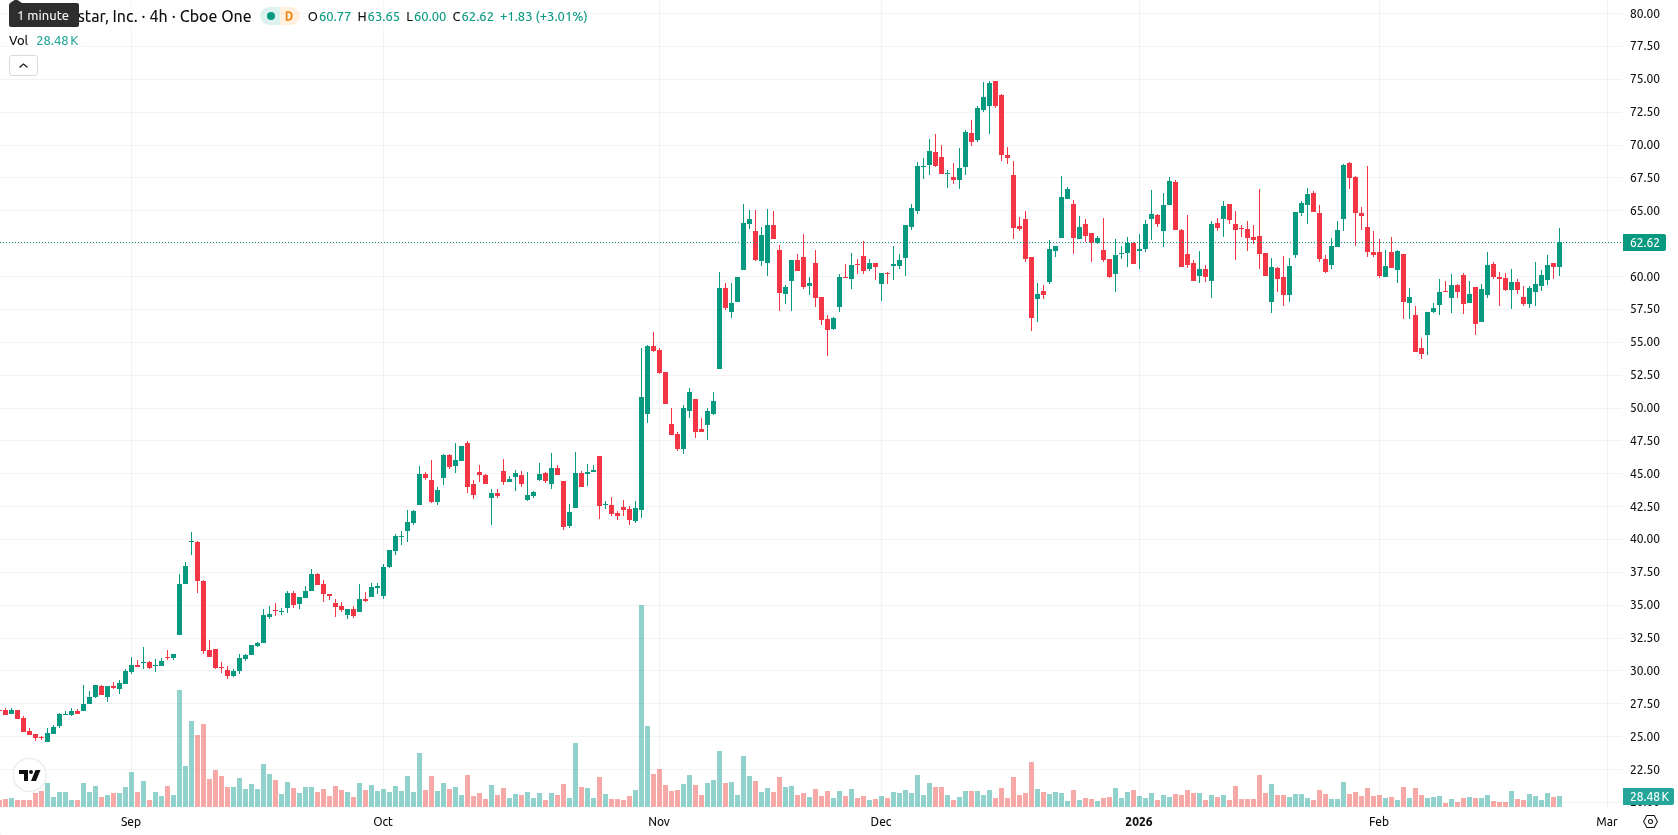
Globalstar, Inc. (GSAT) is trading at $62.87, placing it above the MA-20 ($60.20), MA-50 ($62.25), and MA-200 ($41.37). This shows bullish momentum in both the short and long term, with immediate session support from the Ichimoku Kijun at $61.22 and resistance from the MA-50 due to their close proximity.
Highlights
- Globalstar is set to report Q4 2025 earnings on February 27, with consensus expecting $0.01 EPS and $71.8 million in revenue, reflecting steady estimates over 60 days.
- Growth continues in wholesale services, Commercial IoT, and government-driven deals, though Globalstar is navigating macroeconomic uncertainty and higher investment spending.
- GSAT trades above key technical levels (MA-20 $60.20, MA-50 $62.25, MA-200 $41.37) with intraday volatility high and $61.22 (Ichimoku Kijun) as immediate support; 5-day range seen at $60.00–$66.00.
Steady earnings forecast as service growth offsets macro risks
Globalstar is scheduled to report its fourth-quarter 2025 earnings before the market opens on February 27. The consensus estimate is for earnings of one cent per share with total revenues of $71.8 million, and these expectations have remained steady over the last 60 days. The company continues to see growth in wholesale services, Commercial IoT, and government-driven deals while managing ongoing macroeconomic uncertainty and higher investment spending.
Mixed momentum as MACD divergence contrasts overbought oscillators
Technically, momentum signals are mixed; the daily MACD reflects strong selling pressure while the ADX is neutral, indicating an unclear trend. The RSI is in bullish territory, but Stochastic RSI and Bull/Bear Power show overbought conditions and intraday buyer dominance. The Commodity Channel Index is neutral, and the Awesome Oscillator does not confirm the upward move. GSAT opened almost flat and is near the session's high end of the $59.98 – $63.73 range, with high intraday volatility and some risk of a short-term pullback due to divergence between MACD and oscillators.
High upside probability as consolidation precedes breakout potential
For the next five days, GSAT is expected to fluctuate within a volatility band of $60.00 to $66.00. The probability of a price increase stands above 80%, supported by strong signals from weekly Moving Average, RSI, ADX, and MACD readings. The baseline scenario is for consolidation in this range, with an upside breakout possible if buying momentum builds. A reversal toward $61.22 could trigger a move to next support at $60.00.
Last time, analysts noted that Globalstar, Inc. (GSAT) trades just below its 20- and 50-day moving averages, reflecting short- to medium-term selling pressure, while it remains well above the 200-day average, indicating longer-term support. Technical indicators are mixed, with MACD signaling sustained bearish momentum, RSI near neutral, and key resistance seen around $61.22 as recent volatility underscores uncertain near-term direction.


Latest Globalstar News


-
 Afghanistan
-
 Albania
-
 Algeria
-
 Angola
-
 Argentina
-
 Armenia
-
 Australia
-
 Austria
-
 Azerbaijan
-
 Bahamas
-
 Bahrain
-
 Bangladesh
-
 Belarus
-
 Belgium
-
 Bolivia
-
 Botswana
-
 Brazil
-
 Brunei
-
 Bulgaria
-
 Cambodia
-
 Cameroon
-
 Canada
-
 Chile
Chile
-
 China
China
-
 Colombia
-
 Congo
Congo
-
 Costa Rica
-
 Cote d'Ivoire
-
 Croatia
-
 Cuba
Cuba
-
 Cyprus
-
 Czechia
-
 DR Congo
-
 Denmark
-
 Dominican Republic
-
 Ecuador
-
 Egypt
Egypt
-
 El Salvador
-
 Estonia
-
 Eswatini
-
 Ethiopia
-
 Finland
-
 France
-
 Georgia
-
 Germany
-
 Ghana
Ghana
-
 Greece
-
 Haiti
Haiti
-
 Hong Kong
-
 Hungary
-
 India
India
-
 Indonesia
-
 Iran, Islamic republic
-
 Iraq
Iraq
-
 Ireland
-
 Israel
-
 Italy
Italy
-
 Jamaica
-
 Japan
Japan
-
 Jordan
-
 Kazakhstan
-
 Kenya
Kenya
-
 Korea
Korea
-
 Kuwait
-
 Kyrgyzstan
-
 Laos
Laos
-
 Latvia
-
 Lebanon
-
 Lesotho
-
 Libya
Libya
-
 Lithuania
-
 Luxembourg
-
 Madagascar
-
 Malaysia
-
 Malta
Malta
-
 Mauritius
-
 Mexico
-
 Moldova
-
 Mongolia
-
 Montenegro
-
 Morocco
-
 Mozambique
-
 Myanmar
-
 Namibia
-
 Nepal
Nepal
-
 Netherlands
-
 New Zealand
-
 Nigeria
-
 North Macedonia
-
 Norway
-
 Oman
Oman
-
 Pakistan
-
 Palestine
-
 Panama
-
 Papua New Guinea
-
 Paraguay
-
 Peru
Peru
-
 Philippines
-
 Poland
-
 Portugal
-
 Puerto Rico
-
 Qatar
Qatar
-
 Reunion
-
 Romania
-
 Rwanda
-
 Saudi Arabia
-
 Serbia
-
 Singapore
-
 Slovakia
-
 Slovenia
-
 Somalia
-
 South Africa
-
 Spain
Spain
-
 Sri Lanka
-
 Sweden
-
 Switzerland
-
 Syria
Syria
-
 Taiwan
-
 Tajikistan
-
 Tanzania
-
 Thailand
-
 Trinidad and Tobago
-
 Tunisia
-
 Turkey
-
 UAE
UAE
-
 Uganda
-
 Ukraine
-
 United Kingdom
-
United States
-
 Uruguay
-
 Uzbekistan
-
 Venezuela
-
 Vietnam
-
 Yemen
Yemen
-
 Zambia
-
 Zimbabwe
- Forex
- Crypto
