
-4.38% for Globalstar stock — Sellers dominate despite bullish long-term structure

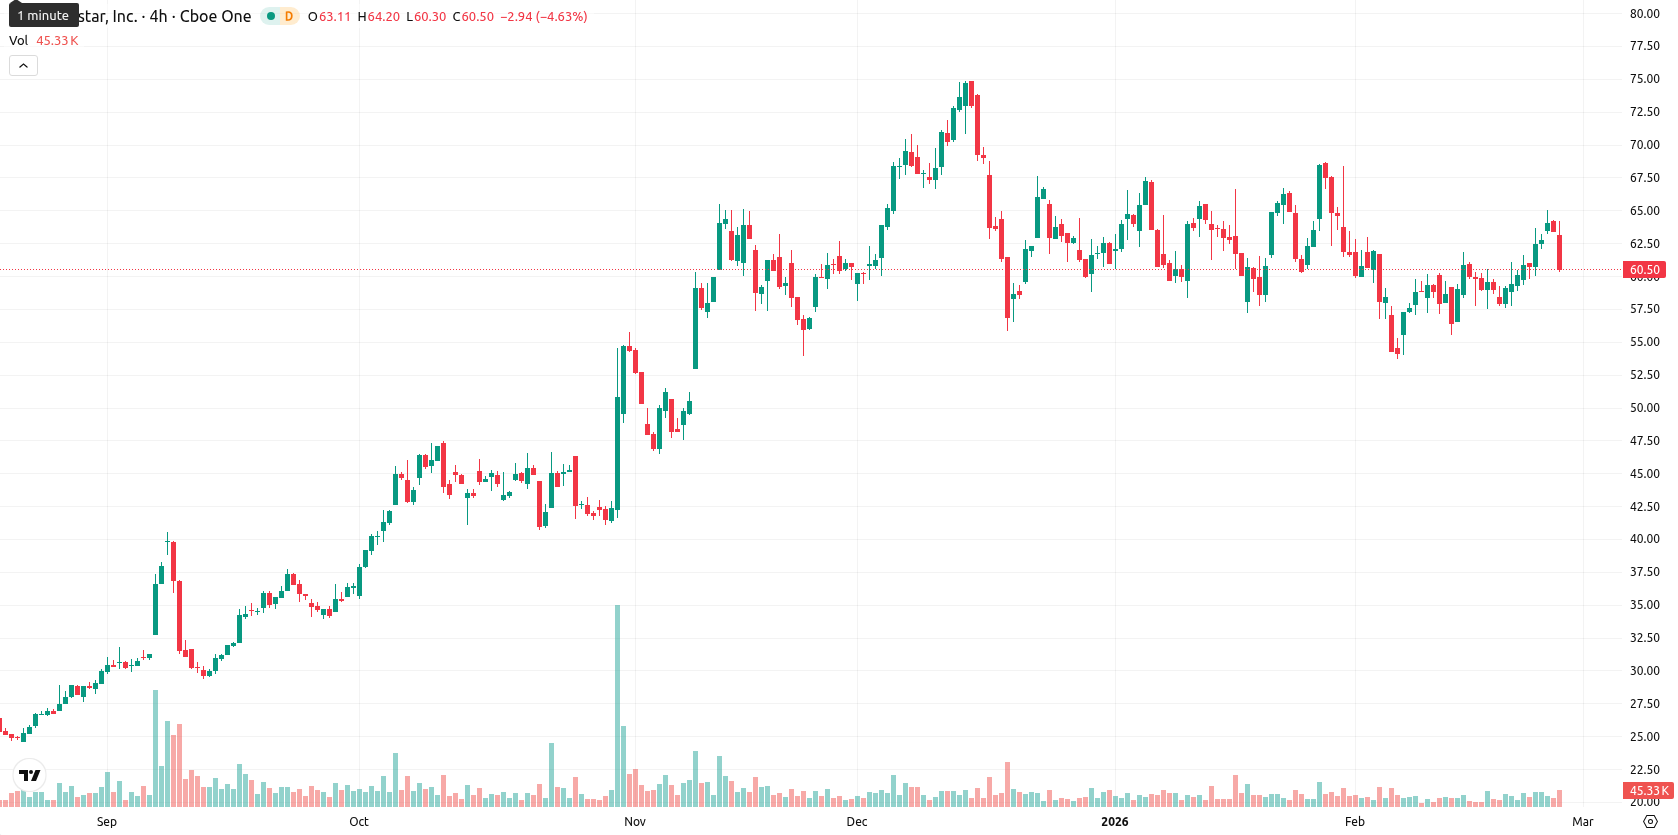
Globalstar, Inc. (GSAT) is trading at $60.66 after a daily decrease of 4.38%, positioning just above its 20-day moving average of $60.32, below the 50-day at $61.90, and well above the 200-day at $41.80.
Highlights
- Globalstar will announce quarterly earnings on February 27, 2026, following a 2.13% year-on-year revenue growth reported as of September 30, 2025.
- Analysts expect Globalstar’s revenue growth to moderate in the upcoming quarter, while persistent broad-based selling pressure has impacted recent price action.
- GSAT is trading at $60.66 near its 20-day Moving Average, with key resistance at $61.22 and short-term support at $60.00 and $57.00.
Broad selling pressure persists as growth expectations moderate
Globalstar is scheduled to announce its quarterly earnings results on February 27, 2026. The company reported a 2.13% year-on-year revenue growth as of September 30, 2025. Analysts anticipate a moderation in revenue growth for the upcoming quarter, though price action has remained under broader selling pressure.
Neutral near-term setup amid mixed momentum and resistance at $61.22
GSAT maintains a bullish long-term setup given its position relative to the 200-day average, while the near-term picture is more neutral as it consolidates between the 20- and 50-day moving averages. The Ichimoku Kijun at $61.22 now acts as immediate resistance. Momentum indicators, including MACD and ADX, are neutral on the daily chart, with RSI in buy territory and both the Stochastic RSI and CCI signaling overbought conditions. Bull/Bear Power also indicates recent buyer dominance, but with divergences among oscillators, the ongoing intraday decline reflects persistent seller control and high volatility.
High rebound odds as volatility guides base-case consolidation scenario
Over the next five trading days, price action is expected within a typical volatility band of $57.00 to $64.50. Probability of a price rebound is high (above 80%), suggesting a sideways base-case scenario below $61.22 resistance. A bullish move would be confirmed on a breakout above this level, while a bearish scenario involves a drop below $60.00 and towards $57.00 support before potential buying interest returns.
Currently, Globalstar Inc. is trading above its key moving averages, with price holding above short- and medium-term supports and facing near-term resistance at both the 50-day average and a nearby round number. Momentum signals are mixed as daily RSI is moderately bullish but overbought conditions and weak intraday trend strength reflect selling pressure and volatility, highlighting a divergence between longer-term trend support and current intraday weakness.


Latest Globalstar News


-
 Afghanistan
-
 Albania
-
 Algeria
-
 Angola
-
 Argentina
-
 Armenia
-
 Australia
-
 Austria
-
 Azerbaijan
-
 Bahamas
-
 Bahrain
-
 Bangladesh
-
 Belarus
-
 Belgium
-
 Bolivia
-
 Botswana
-
 Brazil
-
 Brunei
-
 Bulgaria
-
 Cambodia
-
 Cameroon
-
 Canada
-
 Chile
Chile
-
 China
China
-
 Colombia
-
 Congo
Congo
-
 Costa Rica
-
 Cote d'Ivoire
-
 Croatia
-
 Cuba
Cuba
-
 Cyprus
-
 Czechia
-
 DR Congo
-
 Denmark
-
 Dominican Republic
-
 Ecuador
-
 Egypt
Egypt
-
 El Salvador
-
 Estonia
-
 Eswatini
-
 Ethiopia
-
 Finland
-
 France
-
 Georgia
-
 Germany
-
 Ghana
Ghana
-
 Greece
-
 Haiti
Haiti
-
 Hong Kong
-
 Hungary
-
 India
India
-
 Indonesia
-
 Iran, Islamic republic
-
 Iraq
Iraq
-
 Ireland
-
 Israel
-
 Italy
Italy
-
 Jamaica
-
 Japan
Japan
-
 Jordan
-
 Kazakhstan
-
 Kenya
Kenya
-
 Korea
Korea
-
 Kuwait
-
 Kyrgyzstan
-
 Laos
Laos
-
 Latvia
-
 Lebanon
-
 Lesotho
-
 Libya
Libya
-
 Lithuania
-
 Luxembourg
-
 Madagascar
-
 Malaysia
-
 Malta
Malta
-
 Mauritius
-
 Mexico
-
 Moldova
-
 Mongolia
-
 Montenegro
-
 Morocco
-
 Mozambique
-
 Myanmar
-
 Namibia
-
 Nepal
Nepal
-
 Netherlands
-
 New Zealand
-
 Nigeria
-
 North Macedonia
-
 Norway
-
 Oman
Oman
-
 Pakistan
-
 Palestine
-
 Panama
-
 Papua New Guinea
-
 Paraguay
-
 Peru
Peru
-
 Philippines
-
 Poland
-
 Portugal
-
 Puerto Rico
-
 Qatar
Qatar
-
 Reunion
-
 Romania
-
 Rwanda
-
 Saudi Arabia
-
 Serbia
-
 Singapore
-
 Slovakia
-
 Slovenia
-
 Somalia
-
 South Africa
-
 Spain
Spain
-
 Sri Lanka
-
 Sweden
-
 Switzerland
-
 Syria
Syria
-
 Taiwan
-
 Tajikistan
-
 Tanzania
-
 Thailand
-
 Trinidad and Tobago
-
 Tunisia
-
 Turkey
-
 UAE
UAE
-
 Uganda
-
 Ukraine
-
 United Kingdom
-
United States
-
 Uruguay
-
 Uzbekistan
-
 Venezuela
-
 Vietnam
-
 Yemen
Yemen
-
 Zambia
-
 Zimbabwe
- Forex
- Crypto
