
Alphabet stock price forecast: Resistance at $305 caps gains as GOOGL faces selling pressure

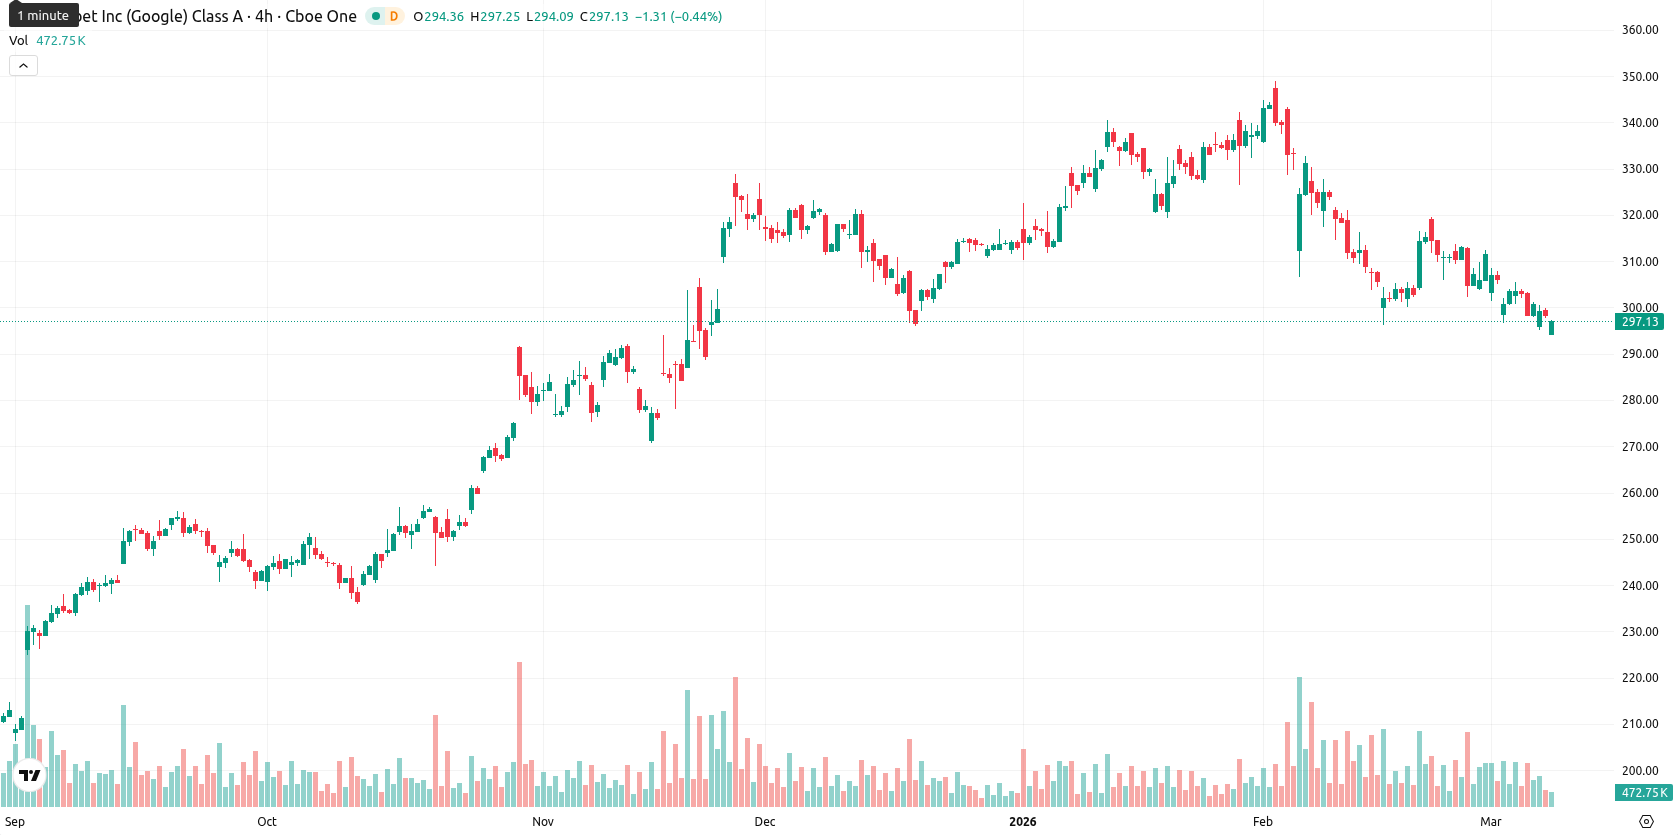
Alphabet Inc. (GOOGL) is trading at $296.86 after slipping 0.49% today. The price remains below both the MA-20 ($309.08) and MA-50 ($319.79), though it is well above MA-200 ($253.05), highlighting short- and medium-term selling pressure while retaining a longer-term bullish structure. The Ichimoku Kijun at $322.15 acts as immediate resistance.
Highlights
- Alphabet approved a new three-year CEO compensation package worth up to $692 million, with performance incentives tied to units like Waymo and Wing.
- Quarterly earnings per share of $2.82 exceeded estimates, with revenue reaching $113.83 billion and a new $0.21 dividend declared.
- Shares are experiencing short- and medium-term selling pressure with negative momentum signals, likely to consolidate between $285 and $305, with technical indicators showing oversold conditions.
Positive earnings and CEO compensation fail to stem selling pressure
Alphabet’s board approved a new three-year compensation package for CEO Sundar Pichai, with a potential value of up to $692 million and a significant portion tied to the performance of units like Waymo and Wing. The company recently reported quarterly earnings per share of $2.82, exceeding estimates, and revenue reached $113.83 billion. A quarterly dividend of $0.21 per share was also declared, with a record date of March 9 and payment scheduled for March 16, 2026, though price action has remained under broader selling pressure.
Oversold signals deepen as technical momentum favors sellers
Momentum signals are negative on the daily chart, with both MACD and ADX currently indicating "Sell". The price sits below the MA-20 ($309.08) and MA-50 ($319.79), while remaining well above the MA-200 ($253.05), confirming seller pressure in the short and medium term but bullish longer-term structure. Key resistance is at the Ichimoku Kijun ($322.15). RSI and Commodity Channel Index both signal oversold conditions, and Stochastic RSI is oversold across most intraday intervals, while Bull/Bear Power also remains at oversold levels (value -6.32). The Awesome Oscillator supports the ongoing sell trend, while trading is near the upper end of today’s range ($294.62–$296.81) with moderate volatility.
Sideways or downward bias likely amid low breakout odds
Over the next five trading days, GOOGL is expected to consolidate within a typical volatility band of $285 to $305 around current levels. The probability of a significant upward break (above $305) is very low (less than 20%), while a downward or sideways continuation is more likely given prevailing momentum. Baseline scenario is a sideways move between $285 and $305. A bullish move above $305 could see the next resistance at $322.15, while a breach of $285 may open up a move toward MA-200 at $253.05.
Last time, analysts noted that Alphabet Inc. (GOOGL) is trading with a negative intraday tone and remains below its 20- and 50-day moving averages, with technical indicators such as MACD and RSI pointing to continued seller pressure. The stock maintains support above the 200-day moving average, while resistance is observed near $322.15, and the 5-day forecast range suggests ongoing consolidation between $285.00 and $305.00.


Latest Google News


-
 Afghanistan
-
 Albania
-
 Algeria
-
 Angola
-
 Argentina
-
 Armenia
-
 Australia
-
 Austria
-
 Azerbaijan
-
 Bahamas
-
 Bahrain
-
 Bangladesh
-
 Belarus
-
 Belgium
-
 Bolivia
-
 Botswana
-
 Brazil
-
 Brunei
-
 Bulgaria
-
 Cambodia
-
 Cameroon
-
 Canada
-
 Chile
Chile
-
 China
China
-
 Colombia
-
 Congo
Congo
-
 Costa Rica
-
 Cote d'Ivoire
-
 Croatia
-
 Cuba
Cuba
-
 Cyprus
-
 Czechia
-
 DR Congo
-
 Denmark
-
 Dominican Republic
-
 Ecuador
-
 Egypt
Egypt
-
 El Salvador
-
 Estonia
-
 Eswatini
-
 Ethiopia
-
 Finland
-
 France
-
 Georgia
-
 Germany
-
 Ghana
Ghana
-
 Greece
-
 Haiti
Haiti
-
 Hong Kong
-
 Hungary
-
 India
India
-
 Indonesia
-
 Iran, Islamic republic
-
 Iraq
Iraq
-
 Ireland
-
 Israel
-
 Italy
Italy
-
 Jamaica
-
 Japan
Japan
-
 Jordan
-
 Kazakhstan
-
 Kenya
Kenya
-
 Korea
Korea
-
 Kuwait
-
 Kyrgyzstan
-
 Laos
Laos
-
 Latvia
-
 Lebanon
-
 Lesotho
-
 Libya
Libya
-
 Lithuania
-
 Luxembourg
-
 Madagascar
-
 Malaysia
-
 Malta
Malta
-
 Mauritius
-
 Mexico
-
 Moldova
-
 Mongolia
-
 Montenegro
-
 Morocco
-
 Mozambique
-
 Myanmar
-
 Namibia
-
 Nepal
Nepal
-
 Netherlands
-
 New Zealand
-
 Nigeria
-
 North Macedonia
-
 Norway
-
 Oman
Oman
-
 Pakistan
-
 Palestine
-
 Panama
-
 Papua New Guinea
-
 Paraguay
-
 Peru
Peru
-
 Philippines
-
 Poland
-
 Portugal
-
 Puerto Rico
-
 Qatar
Qatar
-
 Reunion
-
 Romania
-
 Rwanda
-
 Saudi Arabia
-
 Serbia
-
 Singapore
-
 Slovakia
-
 Slovenia
-
 Somalia
-
 South Africa
-
 Spain
Spain
-
 Sri Lanka
-
 Sweden
-
 Switzerland
-
 Syria
Syria
-
 Taiwan
-
 Tajikistan
-
 Tanzania
-
 Thailand
-
 Trinidad and Tobago
-
 Tunisia
-
 Turkey
-
 UAE
UAE
-
 Uganda
-
 Ukraine
-
 United Kingdom
-
United States
-
 Uruguay
-
 Uzbekistan
-
 Venezuela
-
 Vietnam
-
 Yemen
Yemen
-
 Zambia
-
 Zimbabwe
- Forex
- Crypto
