
Arm stock falls as insider selling adds to available float

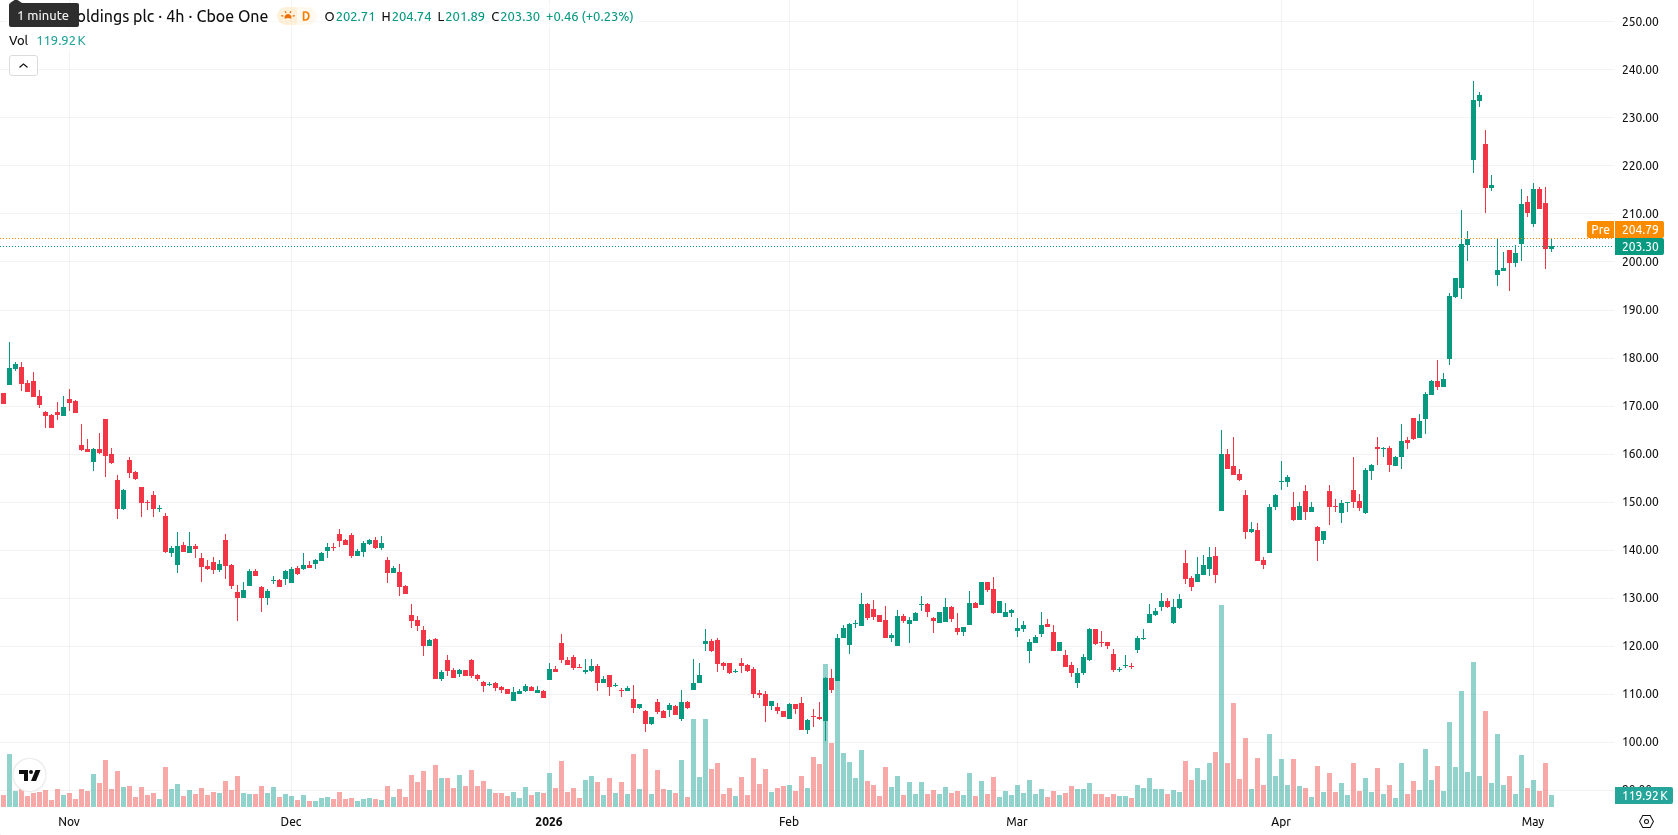
Arm Holdings (ARM) is trading at $203.26, down 3.70% on the day. The price remains well above its key moving averages, with supportive structure across short-, medium-, and long-term timeframes.
Highlights
- TSMC's complete exit and recent insider selling have increased Arm Holdings' market float, creating potential supply-driven price pressure.
- Despite selling pressure, management reaffirmed Q4 FY2026 revenue and EPS guidance, with earnings set for release on May 6, 2026.
- Arm maintains a bullish long-term trend with support near $186.75 and is expected to trade between $198.00 and $210.00 this week, though intraday weakness signals caution.
Supply pressure rising as major holder exits and insiders sell
TSMC recently completed the sale of its stake in Arm Holdings, increasing the available float and introducing potential supply-side pressure as investors weigh the implications of a major stakeholder's exit. Further contributing to near-term caution, insider selling by Arm executives has also added to shares available on the market. Management reaffirmed its Q4 FY2026 revenue and adjusted EPS guidance at an investor event on March 23, 2026, signaling maintained expectations ahead of the scheduled earnings report on May 6, 2026, though price action has remained under broader selling pressure.
Bullish trend endures as technical support holds amid exhaustion signs
Key technical levels remain pronounced: ARM trades well above the SMA-20 at $181.31, SMA-50 at $151.39, and SMA-200 at $141.51, reflecting continued bullish momentum across multiple timeframes. The Ichimoku Kijun at $186.75 now acts as immediate support. Daily momentum indicators on D1 are strong: MACD and ADX both register Buy signals, while RSI holds at 62 and CCI at 68.9, indicating persistent bullish bias. However, Stoch RSI is deeply oversold on several timeframes, and BBP signals overbought conditions but has shifted to seller dominance on intraday charts. The Awesome Oscillator remains neutral, offering little additional direction, and moderate to high volatility is noted. This lineup highlights ongoing bullish structure despite emerging short-term exhaustion.
Sideways bias expected as volatility persists within bullish context
Over the coming week, typical volatility suggests ARM may trade within a $198.00–$210.00 band relative to current levels. The probability of further gains remains high at 80%, with the most likely scenario being sideways movement within this corridor as medium- and long-term bullish patterns prevail. Should ARM overcome resistance, a breakout toward recent highs may unfold, while a breach below immediate support at $186.75 could prompt further downside — although current indicator configurations make this less probable.
Earlier, analysts noted that Arm Holdings was displaying persistent bullish momentum supported by robust technical signals and positive sentiment. The current analysis confirms this underlying strength but introduces heightened focus on insider and major holder selling, making market response to the May 6 earnings report a pivotal factor for any further upside.


Latest Arm News


-
 Afghanistan
-
 Albania
-
 Algeria
-
 Angola
-
 Argentina
-
 Armenia
-
 Australia
-
 Austria
-
 Azerbaijan
-
 Bahamas
-
 Bahrain
-
 Bangladesh
-
 Belarus
-
 Belgium
-
 Bolivia
-
 Botswana
-
 Brazil
-
 Brunei
-
 Bulgaria
-
 Cambodia
-
 Cameroon
-
 Canada
-
 Chile
Chile
-
 China
China
-
 Colombia
-
 Congo
Congo
-
 Costa Rica
-
 Cote d'Ivoire
-
 Croatia
-
 Cuba
Cuba
-
 Cyprus
-
 Czechia
-
 DR Congo
-
 Denmark
-
 Dominican Republic
-
 Ecuador
-
 Egypt
Egypt
-
 El Salvador
-
 Estonia
-
 Eswatini
-
 Ethiopia
-
 Finland
-
 France
-
 Georgia
-
 Germany
-
 Ghana
Ghana
-
 Greece
-
 Haiti
Haiti
-
 Hong Kong
-
 Hungary
-
 India
India
-
 Indonesia
-
 Iran, Islamic republic
-
 Iraq
Iraq
-
 Ireland
-
 Israel
-
 Italy
Italy
-
 Jamaica
-
 Japan
Japan
-
 Jordan
-
 Kazakhstan
-
 Kenya
Kenya
-
 Korea
Korea
-
 Kuwait
-
 Kyrgyzstan
-
 Laos
Laos
-
 Latvia
-
 Lebanon
-
 Lesotho
-
 Libya
Libya
-
 Lithuania
-
 Luxembourg
-
 Madagascar
-
 Malaysia
-
 Malta
Malta
-
 Mauritius
-
 Mexico
-
 Moldova
-
 Mongolia
-
 Montenegro
-
 Morocco
-
 Mozambique
-
 Myanmar
-
 Namibia
-
 Nepal
Nepal
-
 Netherlands
-
 New Zealand
-
 Nigeria
-
 North Macedonia
-
 Norway
-
 Oman
Oman
-
 Pakistan
-
 Palestine
-
 Panama
-
 Papua New Guinea
-
 Paraguay
-
 Peru
Peru
-
 Philippines
-
 Poland
-
 Portugal
-
 Puerto Rico
-
 Qatar
Qatar
-
 Reunion
-
 Romania
-
 Rwanda
-
 Saudi Arabia
-
 Serbia
-
 Singapore
-
 Slovakia
-
 Slovenia
-
 Somalia
-
 South Africa
-
 Spain
Spain
-
 Sri Lanka
-
 Sweden
-
 Switzerland
-
 Syria
Syria
-
 Taiwan
-
 Tajikistan
-
 Tanzania
-
 Thailand
-
 Trinidad and Tobago
-
 Tunisia
-
 Turkey
-
 UAE
UAE
-
 Uganda
-
 Ukraine
-
 United Kingdom
-
United States
-
 Uruguay
-
 Uzbekistan
-
 Venezuela
-
 Vietnam
-
 Yemen
Yemen
-
 Zambia
-
 Zimbabwe
- Forex
- Crypto
