
+2.48% for Nano Dimension stock as limited selling emerges near oversold levels

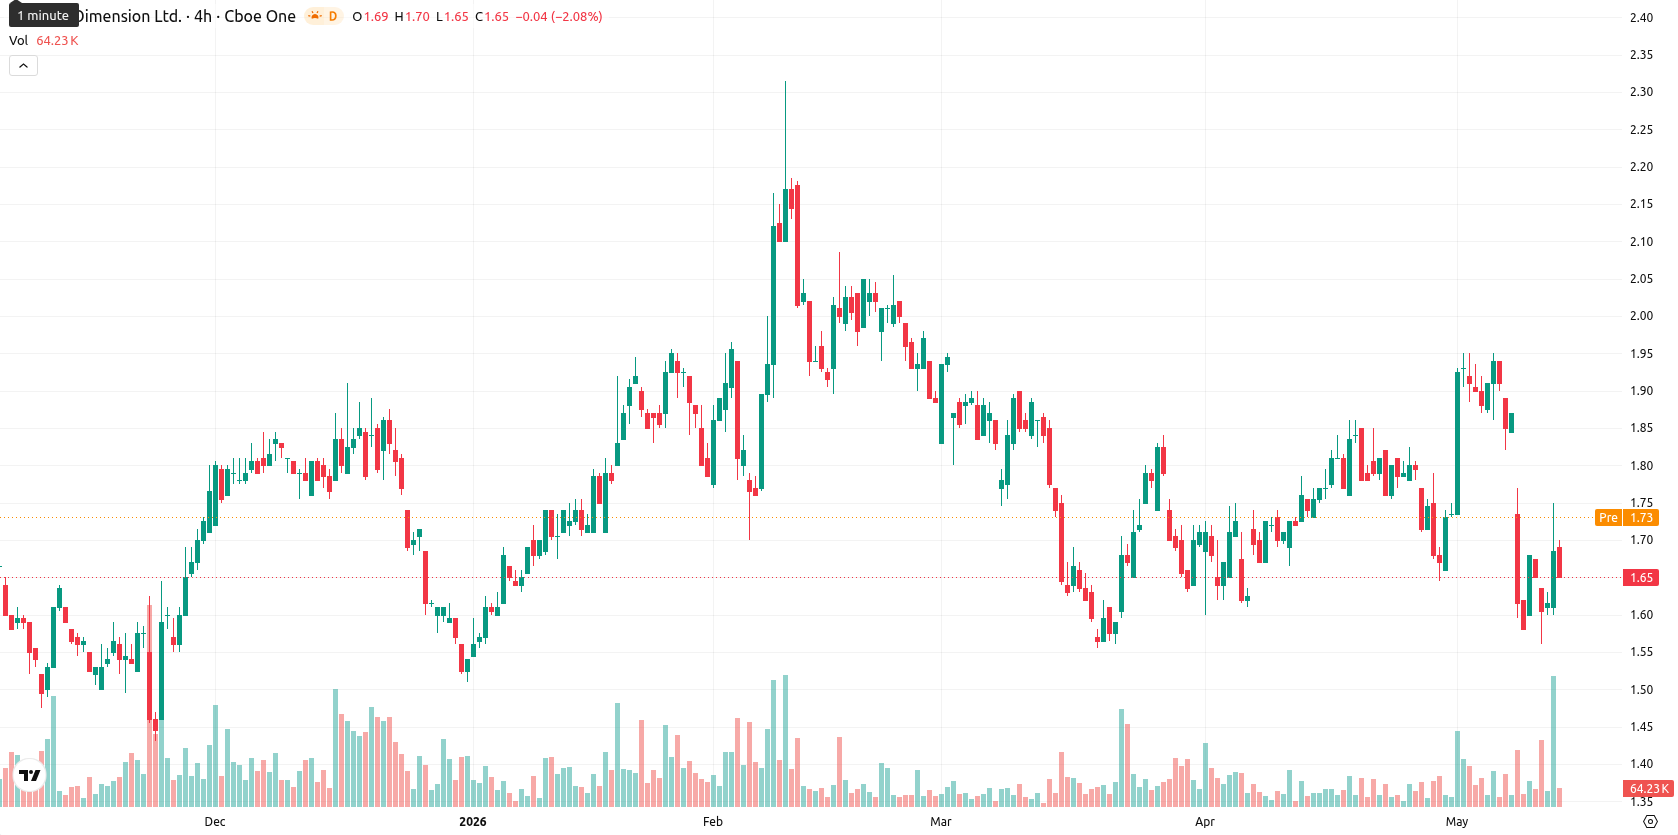
Nano Dimension Ltd (NNDM) is trading at $1.65, marking a daily gain of 2.48%. The price remains below its key moving averages, indicating ongoing downside risk.
Highlights
- NNDM trades under key moving averages, reflecting continued selling pressure across all timeframes and a broadly bearish bias.
- Mixed momentum indicators reveal weak trend conviction, with oversold signals suggesting possible short-term downside exhaustion.
- Price is likely to fluctuate between $1.60 support and $1.76 resistance over the next week, with further downside favored unless $1.76 is reclaimed.
Bearish signals persist as resistance holds and divergence widens
NNDM is trading below its MA-20 ($1.78), MA-50 ($1.75), and is slightly under the MA-200 ($1.68). Immediate resistance is indicated by the Ichimoku Kijun at $1.76. On the momentum front, the MACD signal is flat, while the ADX is weak at 12.58. RSI on the daily chart stands at 43.13 and is flagged as 'Sell', the Stoch RSI is in 'Strong Buy' but remains at a low value, and the CCI is in 'Oversold', all pointing to divergence and possible short-term exhaustion. The BBP is just above neutral at 0.02, suggesting buyers are attempting to establish a foothold, yet the overall configuration from multiple indicators leans bearish. There is no Awesome Oscillator trend support present. Today's trading session began with a minor gap down at the open ($1.60 vs. previous $1.61), and the price now sits at the mid-point of the day's $1.60–$1.75 range, reflecting moderate volatility and partial recovery from early pressure.
Downside bias remains as volatility range caps recovery
For the next five trading days, NNDM is likely to remain within a typical volatility band between $1.60 and $1.76. The probability of a price increase is estimated below 20%, making additional downside risk more plausible in the short term. The baseline scenario favors continued sideways movement, with support seen at $1.60 and resistance at $1.76. Should NNDM close above the $1.76 Ichimoku level, it would reinforce recovery attempts, while a decisive break below $1.60 could open the door to fresh lows.
Previously it was reported that Nano Dimension was under persistent selling pressure amid technical weakness, leading to a cautious outlook. The current setup reinforces this view with continued downside risk, making $1.60 a pivotal support level to monitor for potential renewed declines.


Latest Nano Dimension News


-
 Afghanistan
-
 Albania
-
 Algeria
-
 Angola
-
 Argentina
-
 Armenia
-
 Australia
-
 Austria
-
 Azerbaijan
-
 Bahamas
-
 Bahrain
-
 Bangladesh
-
 Belarus
-
 Belgium
-
 Bolivia
-
 Botswana
-
 Brazil
-
 Brunei
-
 Bulgaria
-
 Cambodia
-
 Cameroon
-
 Canada
-
 Chile
Chile
-
 China
China
-
 Colombia
-
 Congo
Congo
-
 Costa Rica
-
 Cote d'Ivoire
-
 Croatia
-
 Cuba
Cuba
-
 Cyprus
-
 Czechia
-
 DR Congo
-
 Denmark
-
 Dominican Republic
-
 Ecuador
-
 Egypt
Egypt
-
 El Salvador
-
 Estonia
-
 Eswatini
-
 Ethiopia
-
 Finland
-
 France
-
 Georgia
-
 Germany
-
 Ghana
Ghana
-
 Greece
-
 Haiti
Haiti
-
 Hong Kong
-
 Hungary
-
 India
India
-
 Indonesia
-
 Iran, Islamic republic
-
 Iraq
Iraq
-
 Ireland
-
 Israel
-
 Italy
Italy
-
 Jamaica
-
 Japan
Japan
-
 Jordan
-
 Kazakhstan
-
 Kenya
Kenya
-
 Korea
Korea
-
 Kuwait
-
 Kyrgyzstan
-
 Laos
Laos
-
 Latvia
-
 Lebanon
-
 Lesotho
-
 Libya
Libya
-
 Lithuania
-
 Luxembourg
-
 Madagascar
-
 Malaysia
-
 Malta
Malta
-
 Mauritius
-
 Mexico
-
 Moldova
-
 Mongolia
-
 Montenegro
-
 Morocco
-
 Mozambique
-
 Myanmar
-
 Namibia
-
 Nepal
Nepal
-
 Netherlands
-
 New Zealand
-
 Nigeria
-
 North Macedonia
-
 Norway
-
 Oman
Oman
-
 Pakistan
-
 Palestine
-
 Panama
-
 Papua New Guinea
-
 Paraguay
-
 Peru
Peru
-
 Philippines
-
 Poland
-
 Portugal
-
 Puerto Rico
-
 Qatar
Qatar
-
 Reunion
-
 Romania
-
 Rwanda
-
 Saudi Arabia
-
 Serbia
-
 Singapore
-
 Slovakia
-
 Slovenia
-
 Somalia
-
 South Africa
-
 Spain
Spain
-
 Sri Lanka
-
 Sweden
-
 Switzerland
-
 Syria
Syria
-
 Taiwan
-
 Tajikistan
-
 Tanzania
-
 Thailand
-
 Trinidad and Tobago
-
 Tunisia
-
 Turkey
-
 UAE
UAE
-
 Uganda
-
 Ukraine
-
 United Kingdom
-
United States
-
 Uruguay
-
 Uzbekistan
-
 Venezuela
-
 Vietnam
-
 Yemen
Yemen
-
 Zambia
-
 Zimbabwe
- Forex
- Crypto
