
SoFi stock price forecast: $17.53 resistance as SOFI posts 3.02% gain

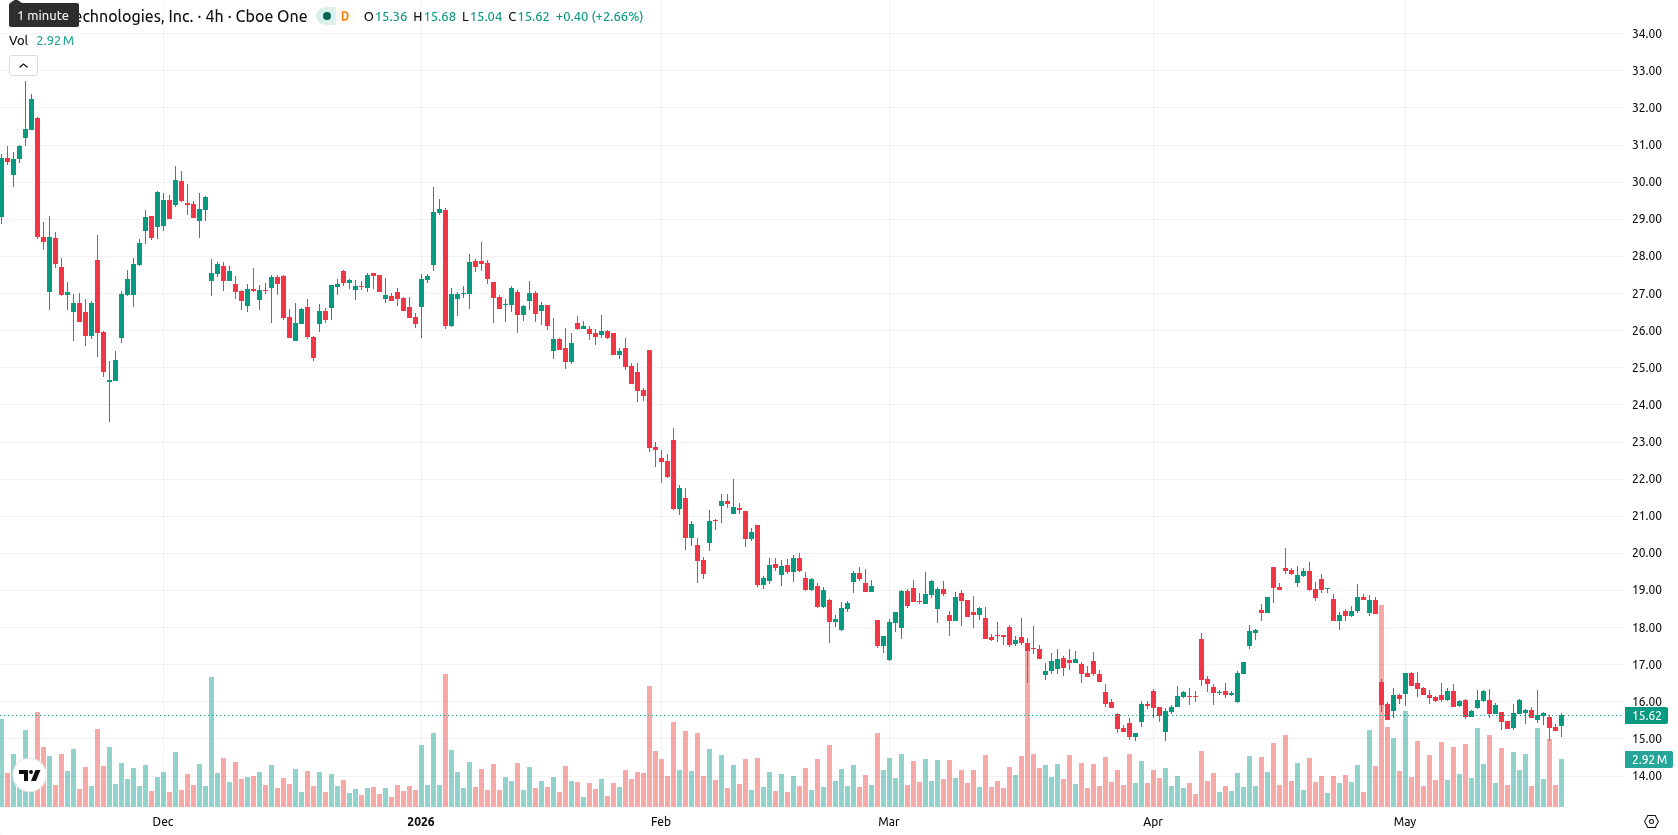
SoFi Technologies, Inc (SOFI) is trading at $15.70, gaining 3.02% on the day as it remains below its key moving averages. The current price is still under short-, medium-, and long-term benchmarks, highlighting ongoing downside pressure.
Highlights
- SoFi faces increasing regulatory and legal scrutiny, including a securities fraud investigation, raising compliance risk and pressuring investor sentiment.
- Despite scrutiny, SoFi’s latest quarter shows strong revenue growth, record 14.7 million membership, but persistent negative free cash flow of -$2.38 billion signals funding risk.
- SOFI trades below key technical resistance, with indicators reflecting persistent bearish momentum and likely sideways-to-down move within a $15.26–$17.59 range in coming sessions.
Compliance risks rise as operational growth tempers sentiment shifts
SoFi is facing increased regulatory and legal scrutiny after Block & Leviton launched a securities fraud investigation in response to a recent short-seller report, raising compliance risks and weighing on investor sentiment. Despite this, the company reported continued operational growth, highlighted by strong revenue gains, new membership reaching a record 14.7 million, and higher net income in the latest quarter, reflecting ongoing demand for its core products. However, mounting pressure on technology platform revenue and a negative free cash flow position of about -$2.38 billion present cash flow and funding challenges, which could temper the impact of its growth metrics.
Technical hurdles persist as negative momentum overshadows rebound
SOFI is currently below its MA-20 at $16.56, MA-50 at $16.91, and MA-200 at $23.42, indicating technical hurdles at each level. The Ichimoku Kijun line at $17.53 stands as immediate resistance. On the daily chart, MACD remains negative and signals a continuing sell trend, while ADX at 19.41 shows a weak trend overall. Oscillator readings — RSI at 39, Stoch RSI at 28, and CCI at -91 — place the stock near oversold territory but not yet at extreme levels; BBP at -0.61 further underscores short-term selling pressure. There is marked divergence as negative momentum readings contrast with today's positive price action.
Sideways consolidation expected as bearish signals dominate outlook
Over the next five sessions, SOFI's trading range is projected between $15.26 and $17.59, with the current price near the lower-midpoint of this volatility band. The likelihood of a price increase remains low — under 20% — since key weekly signals remain bearish. The baseline scenario is for sideways consolidation between support and immediate resistance. A close above $17.53 would shift the outlook toward $17.59, while a drop below $15.26 could trigger further downside as selling momentum continues.
Earlier, analysts noted that persistent bearish momentum and ongoing scrutiny were keeping SoFi shares under sustained seller pressure. With new legal investigations intensifying compliance risks despite recent operational gains, traders should closely monitor the $17.53 resistance level as a potential inflection point for any shift in near-term direction.


Latest SoFi News


-
 Afghanistan
-
 Albania
-
 Algeria
-
 Angola
-
 Argentina
-
 Armenia
-
 Australia
-
 Austria
-
 Azerbaijan
-
 Bahamas
-
 Bahrain
-
 Bangladesh
-
 Belarus
-
 Belgium
-
 Bolivia
-
 Botswana
-
 Brazil
-
 Brunei
-
 Bulgaria
-
 Cambodia
-
 Cameroon
-
 Canada
-
 Chile
Chile
-
 China
China
-
 Colombia
-
 Congo
Congo
-
 Costa Rica
-
 Cote d'Ivoire
-
 Croatia
-
 Cuba
Cuba
-
 Cyprus
-
 Czechia
-
 DR Congo
-
 Denmark
-
 Dominican Republic
-
 Ecuador
-
 Egypt
Egypt
-
 El Salvador
-
 Estonia
-
 Eswatini
-
 Ethiopia
-
 Finland
-
 France
-
 Georgia
-
 Germany
-
 Ghana
Ghana
-
 Greece
-
 Haiti
Haiti
-
 Hong Kong
-
 Hungary
-
 India
India
-
 Indonesia
-
 Iran, Islamic republic
-
 Iraq
Iraq
-
 Ireland
-
 Israel
-
 Italy
Italy
-
 Jamaica
-
 Japan
Japan
-
 Jordan
-
 Kazakhstan
-
 Kenya
Kenya
-
 Korea
Korea
-
 Kuwait
-
 Kyrgyzstan
-
 Laos
Laos
-
 Latvia
-
 Lebanon
-
 Lesotho
-
 Libya
Libya
-
 Lithuania
-
 Luxembourg
-
 Madagascar
-
 Malaysia
-
 Malta
Malta
-
 Mauritius
-
 Mexico
-
 Moldova
-
 Mongolia
-
 Montenegro
-
 Morocco
-
 Mozambique
-
 Myanmar
-
 Namibia
-
 Nepal
Nepal
-
 Netherlands
-
 New Zealand
-
 Nigeria
-
 North Macedonia
-
 Norway
-
 Oman
Oman
-
 Pakistan
-
 Palestine
-
 Panama
-
 Papua New Guinea
-
 Paraguay
-
 Peru
Peru
-
 Philippines
-
 Poland
-
 Portugal
-
 Puerto Rico
-
 Qatar
Qatar
-
 Reunion
-
 Romania
-
 Rwanda
-
 Saudi Arabia
-
 Serbia
-
 Singapore
-
 Slovakia
-
 Slovenia
-
 Somalia
-
 South Africa
-
 Spain
Spain
-
 Sri Lanka
-
 Sweden
-
 Switzerland
-
 Syria
Syria
-
 Taiwan
-
 Tajikistan
-
 Tanzania
-
 Thailand
-
 Trinidad and Tobago
-
 Tunisia
-
 Turkey
-
 UAE
UAE
-
 Uganda
-
 Ukraine
-
 United Kingdom
-
United States
-
 Uruguay
-
 Uzbekistan
-
 Venezuela
-
 Vietnam
-
 Yemen
Yemen
-
 Zambia
-
 Zimbabwe
- Forex
- Crypto
