
Linde stock consolidates as Glenview Trust Co reduces equity stake

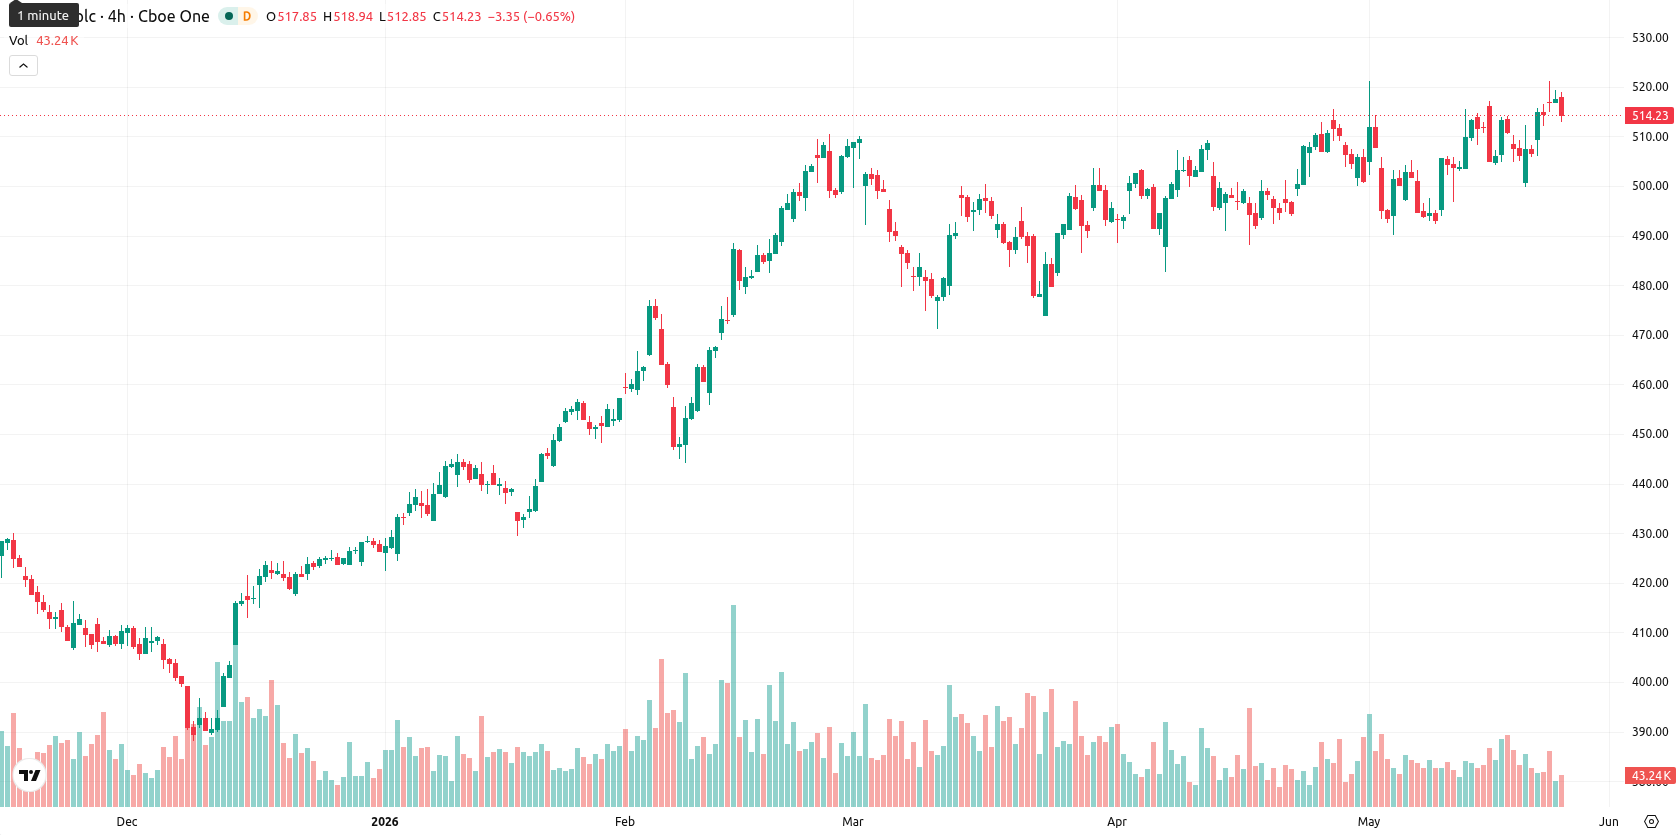
Linde plc (LIN) stock is trading at $514.93 after a daily decline of 0.58%. The price remains above its key moving averages across short, medium, and long-term periods.
Highlights
- Linde reported strong quarterly earnings, demonstrating resilient sales and continued robust operating and financial performance.
- Glenview Trust Co cut its Linde stake by 39.2% in Q4, introducing potential near-term selling pressure from increased supply.
- Technicals show Linde in a well-supported uptrend with a high probability of trading between $505.00 and $530.00 this week, though overbought signals suggest near-term caution.
Institutional exit weighs on shares despite earnings strength
Linde plc reported strong quarterly results, highlighted by solid sales figures and sustained high cash flow, confirming robust operational and financial performance. This backdrop is accompanied by news that Glenview Trust Co, an institutional investor, reduced its position in Linde by 39.2% in the fourth quarter, which may introduce additional shares to the market and contribute to short-term selling activity. Both developments set the tone for trading, though price action has remained under broader selling pressure.
Overbought signals clash with steady support amid mixed momentum
LIN is trading above the SMA-20 at $505.64, the SMA-50 at $499.95, and the SMA-200 at $464.61. The Ichimoku Kijun level at $504.72 acts as immediate technical support. Momentum indicators present a mixed picture, with MACD in buy mode while ADX is neutral, signaling weak trend strength. On the daily timeframe, RSI gives a buy signal, but both Stoch RSI and CCI indicate overbought conditions, with BBP also overbought. The Awesome Oscillator remains neutral. The current price sits near mid-range for the day after a modest initial selloff and moderate intraday volatility. This mix of strong momentum and overbought oscillators suggests a near-term divergence and a need for caution at these levels.
Bullish breakout or pullback hinges on volatility thresholds
Over the coming week, typical volatility implies a price range of $505.00 to $530.00 for LIN. If the price surpasses $530.00, a bullish breakout scenario targets new highs. Conversely, a move below $505.00 would open the door for further pullback, with the $505.00 area serving as the first key support within the weekly volatility band.


-
 Afghanistan
-
 Albania
-
 Algeria
-
 Angola
-
 Argentina
-
 Armenia
-
 Australia
-
 Austria
-
 Azerbaijan
-
 Bahamas
-
 Bahrain
-
 Bangladesh
-
 Belarus
-
 Belgium
-
 Bolivia
-
 Botswana
-
 Brazil
-
 Brunei
-
 Bulgaria
-
 Cambodia
-
 Cameroon
-
 Canada
-
 Chile
Chile
-
 China
China
-
 Colombia
-
 Congo
Congo
-
 Costa Rica
-
 Cote d'Ivoire
-
 Croatia
-
 Cuba
Cuba
-
 Cyprus
-
 Czechia
-
 DR Congo
-
 Denmark
-
 Dominican Republic
-
 Ecuador
-
 Egypt
Egypt
-
 El Salvador
-
 Estonia
-
 Eswatini
-
 Ethiopia
-
 Finland
-
 France
-
 Georgia
-
 Germany
-
 Ghana
Ghana
-
 Greece
-
 Haiti
Haiti
-
 Hong Kong
-
 Hungary
-
 India
India
-
 Indonesia
-
 Iran, Islamic republic
-
 Iraq
Iraq
-
 Ireland
-
 Israel
-
 Italy
Italy
-
 Jamaica
-
 Japan
Japan
-
 Jordan
-
 Kazakhstan
-
 Kenya
Kenya
-
 Korea
Korea
-
 Kuwait
-
 Kyrgyzstan
-
 Laos
Laos
-
 Latvia
-
 Lebanon
-
 Lesotho
-
 Libya
Libya
-
 Lithuania
-
 Luxembourg
-
 Madagascar
-
 Malaysia
-
 Malta
Malta
-
 Mauritius
-
 Mexico
-
 Moldova
-
 Mongolia
-
 Montenegro
-
 Morocco
-
 Mozambique
-
 Myanmar
-
 Namibia
-
 Nepal
Nepal
-
 Netherlands
-
 New Zealand
-
 Nigeria
-
 North Macedonia
-
 Norway
-
 Oman
Oman
-
 Pakistan
-
 Palestine
-
 Panama
-
 Papua New Guinea
-
 Paraguay
-
 Peru
Peru
-
 Philippines
-
 Poland
-
 Portugal
-
 Puerto Rico
-
 Qatar
Qatar
-
 Reunion
-
 Romania
-
 Rwanda
-
 Saudi Arabia
-
 Serbia
-
 Singapore
-
 Slovakia
-
 Slovenia
-
 Somalia
-
 South Africa
-
 Spain
Spain
-
 Sri Lanka
-
 Sweden
-
 Switzerland
-
 Syria
Syria
-
 Taiwan
-
 Tajikistan
-
 Tanzania
-
 Thailand
-
 Trinidad and Tobago
-
 Tunisia
-
 Turkey
-
 UAE
UAE
-
 Uganda
-
 Ukraine
-
 United Kingdom
-
United States
-
 Uruguay
-
 Uzbekistan
-
 Venezuela
-
 Vietnam
-
 Yemen
Yemen
-
 Zambia
-
 Zimbabwe
- Forex
- Crypto
