
+3.14% for SoFi stock as CEO purchases additional company stock

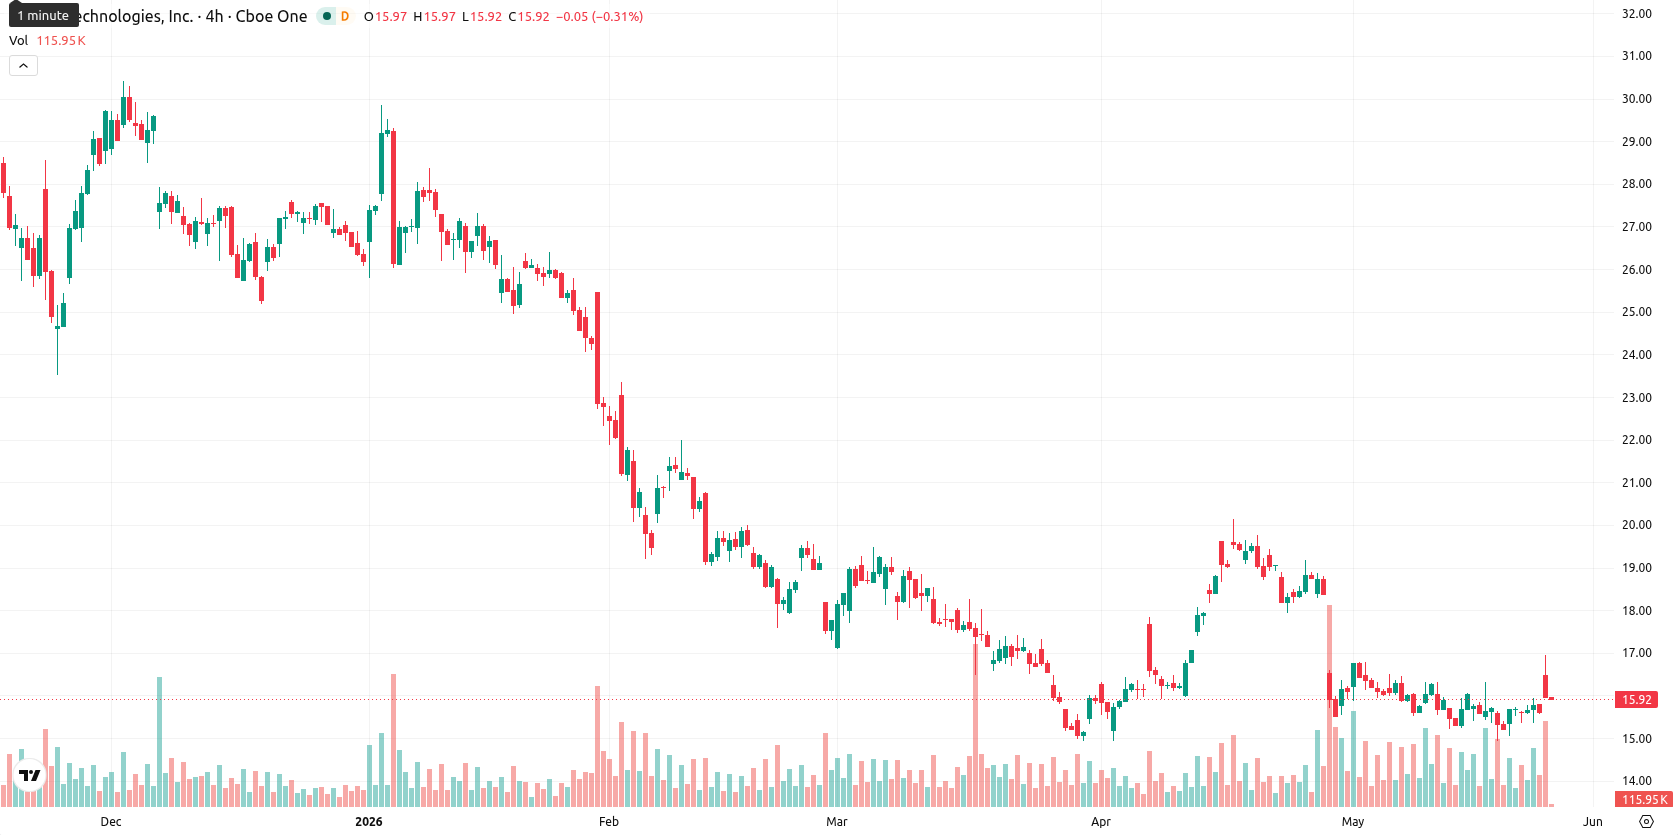
SoFi Technologies, Inc. (SOFI) stock is trading at $16.09, gaining 3.14% on the day. The price currently sits just below its short-term average, while remaining well beneath more medium- and long-term trend lines.
Highlights
- SoFi Technologies posted $1.09 billion in quarterly revenue, up 41% year-over-year, reflecting strong growth in core businesses.
- The company’s membership surpassed 10 million and deposits exceeded $27 billion, with strategic expansion from acquiring Peach for lending infrastructure.
- Technically, SOFI trades below key moving averages and faces moderate bearish momentum, with price expected to consolidate between $15.00 and $17.00 short-term.
Record revenue and user growth as acquisitions drive scale
SoFi Technologies has announced quarterly revenues of $1.09 billion for the period ended May 26, 2026, marking a 41% year-on-year increase and signaling robust expansion in its core business lines. The company’s member base has surpassed 10 million, and total customer deposits have grown beyond $27 billion, highlighting deepening reach and platform engagement. Alongside record loan originations of $12.2 billion, SoFi has enhanced its technology stack through the acquisition of lending infrastructure platform Peach, which is slated to support future scalability. Other recent developments include institutional activity on both sides, with RHL Group LLC acquiring a sizeable new stake and the CEO purchasing additional shares.
Bearish momentum prevails as price meets mixed indicator signals
Technically, SOFI is trading just below the $16.12 SMA-20, well under the $16.76 SMA-50, and far beneath the $23.33 SMA-200. The Ichimoku Kijun level on the daily chart stands at $17.52, marking immediate resistance for any upward move. Momentum remains neutral to negative: both MACD and ADX are showing sell or neutral signals on daily and weekly timeframes. Oscillators paint a mixed picture, with RSI and CCI remaining in sell territory, and the Stoch RSI now showing overbought conditions on D1, suggesting bearish divergence versus recent upward price action. Bull/Bear Power continues to show seller dominance, with price action opening higher and retracing into a mid-range zone between $15.93 and $16.90. Volatility is moderate and intraday tone is mixed, as several oscillators point to limited follow-through behind the day's rebound.
Rangebound outlook persists amid low breakout probability
Looking ahead, SOFI is expected to trade within a volatility band of $15.00 to $17.00 for the coming week. With less than a 20% probability of a sustained increase, the base case scenario is for sideways movement between these levels. If buyers succeed in breaking above resistance at $17.52, the next target would be the range's upper band. Conversely, a move below $15.00 support would put additional downward pressure on the stock given recent trends.
Earlier, analysts noted that persistent bearish momentum and regulatory scrutiny continued to weigh on SoFi shares despite the company’s operational growth. The latest technical readings and fundamental drivers suggest the stock faces ongoing resistance, making any decisive break above the current $17.52 level a crucial signal for potential upside beyond the prevailing consolidation range.


Latest SoFi News


-
 Afghanistan
-
 Albania
-
 Algeria
-
 Angola
-
 Argentina
-
 Armenia
-
 Australia
-
 Austria
-
 Azerbaijan
-
 Bahamas
-
 Bahrain
-
 Bangladesh
-
 Belarus
-
 Belgium
-
 Bolivia
-
 Botswana
-
 Brazil
-
 Brunei
-
 Bulgaria
-
 Cambodia
-
 Cameroon
-
 Canada
-
 Chile
Chile
-
 China
China
-
 Colombia
-
 Congo
Congo
-
 Costa Rica
-
 Cote d'Ivoire
-
 Croatia
-
 Cuba
Cuba
-
 Cyprus
-
 Czechia
-
 DR Congo
-
 Denmark
-
 Dominican Republic
-
 Ecuador
-
 Egypt
Egypt
-
 El Salvador
-
 Estonia
-
 Eswatini
-
 Ethiopia
-
 Finland
-
 France
-
 Georgia
-
 Germany
-
 Ghana
Ghana
-
 Greece
-
 Haiti
Haiti
-
 Hong Kong
-
 Hungary
-
 India
India
-
 Indonesia
-
 Iran, Islamic republic
-
 Iraq
Iraq
-
 Ireland
-
 Israel
-
 Italy
Italy
-
 Jamaica
-
 Japan
Japan
-
 Jordan
-
 Kazakhstan
-
 Kenya
Kenya
-
 Korea
Korea
-
 Kuwait
-
 Kyrgyzstan
-
 Laos
Laos
-
 Latvia
-
 Lebanon
-
 Lesotho
-
 Libya
Libya
-
 Lithuania
-
 Luxembourg
-
 Madagascar
-
 Malaysia
-
 Malta
Malta
-
 Mauritius
-
 Mexico
-
 Moldova
-
 Mongolia
-
 Montenegro
-
 Morocco
-
 Mozambique
-
 Myanmar
-
 Namibia
-
 Nepal
Nepal
-
 Netherlands
-
 New Zealand
-
 Nigeria
-
 North Macedonia
-
 Norway
-
 Oman
Oman
-
 Pakistan
-
 Palestine
-
 Panama
-
 Papua New Guinea
-
 Paraguay
-
 Peru
Peru
-
 Philippines
-
 Poland
-
 Portugal
-
 Puerto Rico
-
 Qatar
Qatar
-
 Reunion
-
 Romania
-
 Rwanda
-
 Saudi Arabia
-
 Serbia
-
 Singapore
-
 Slovakia
-
 Slovenia
-
 Somalia
-
 South Africa
-
 Spain
Spain
-
 Sri Lanka
-
 Sweden
-
 Switzerland
-
 Syria
Syria
-
 Taiwan
-
 Tajikistan
-
 Tanzania
-
 Thailand
-
 Trinidad and Tobago
-
 Tunisia
-
 Turkey
-
 UAE
UAE
-
 Uganda
-
 Ukraine
-
 United Kingdom
-
United States
-
 Uruguay
-
 Uzbekistan
-
 Venezuela
-
 Vietnam
-
 Yemen
Yemen
-
 Zambia
-
 Zimbabwe
- Forex
- Crypto
