
Polkadot price prediction: breakout ahead? DOT gains 5.94% amid seller pressure

Polkadot (DOT) is trading below its MA-20 ($2.261), MA-50 ($2.666), and MA-200 ($3.581), signaling ongoing pressure from sellers in the medium and long term despite some short-term strength.
Highlights
- Polkadot's Relay Chain processed over 32 million transactions in October 2024, indicating strong network activity and rising unique wallet participation.
- The ecosystem is expanding with new custom parachains and the launch of the Join-Accumulate Machine (JAM) chain to enhance blockchain and Web3 interoperability.
- Polkadot will host an AMA livestream on December 10, 2024, to present $40,000 Builder Party Hackathon winners and share insights for developers.
Network usage and ecosystem growth underpin developer interest surge
Polkadot has shown strong network activity, with its main Relay Chain processing over 32 million transactions in October 2024, highlighting increased user engagement and the rise of unique wallets. The ecosystem is expanding with the introduction of custom parachains and the launch of the Join-Accumulate Machine (JAM) chain to improve blockchain and Web3 interoperability. Additionally, Polkadot is set to host an AMA livestream on December 10, 2024, to showcase winning projects from its $40,000 Builder Party Hackathon and provide insights for developers.
Renewed downside pressure as mixed oscillators follow intraday overbought
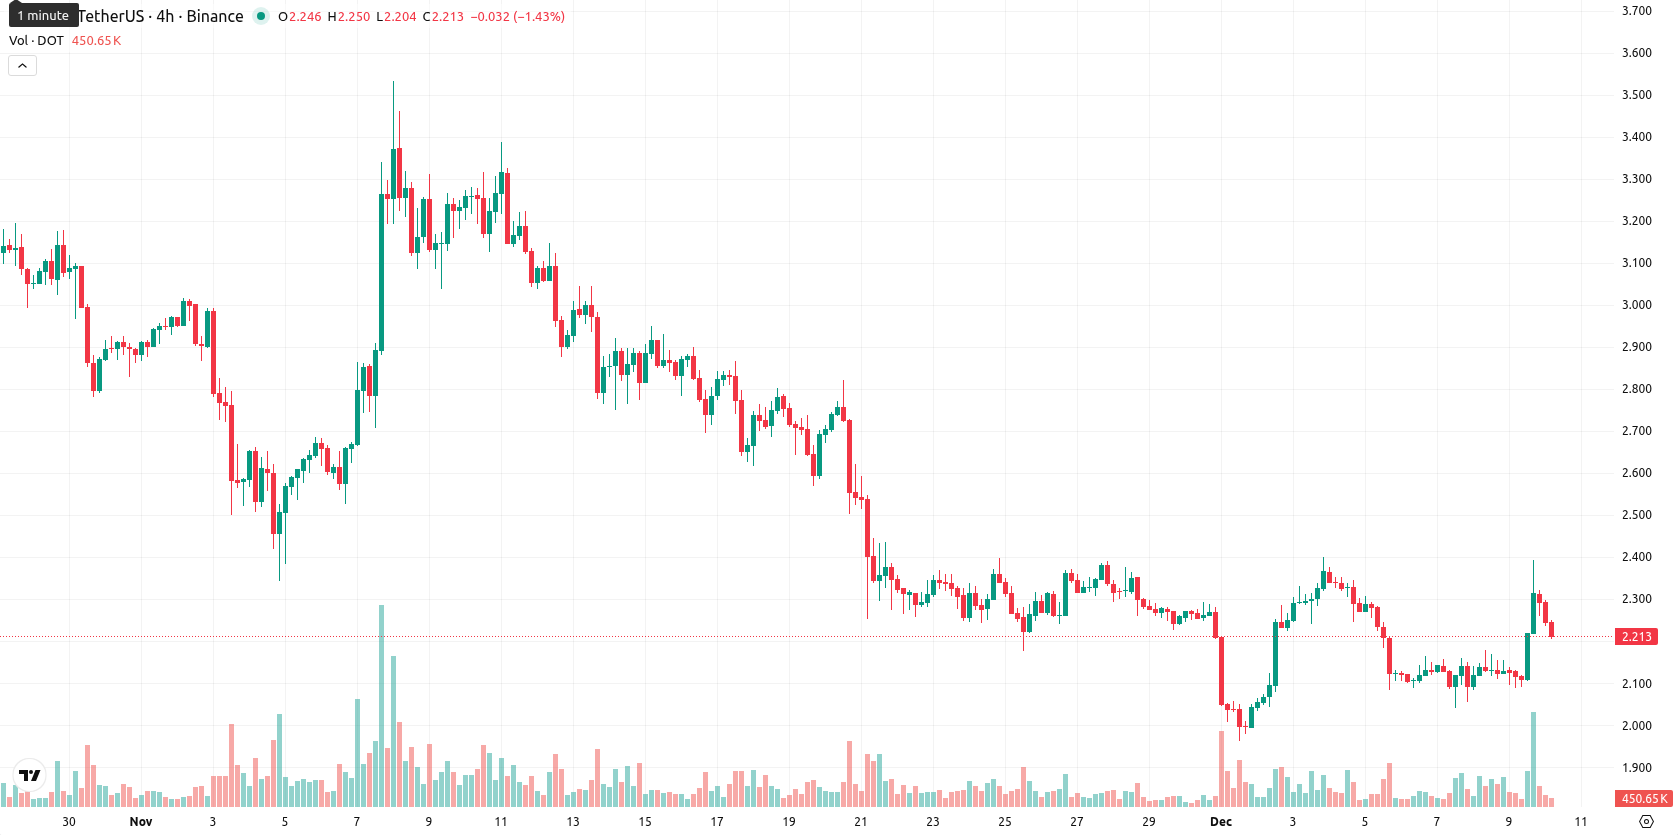
The nearest dynamic resistance is at the Ichimoku Kijun level of $2.455, with no golden or death cross present. Daily MACD indicates strong downside pressure and ADX on D1 confirms a strong trend with a sell signal. Stoch RSI is at 100, reflecting overbought intraday, while RSI and CCI lean slightly bearish to neutral; Bull/Bear Power shows strong buyer presence intraday. After an opening gap higher, DOT is now near the lower end of its daily range following a peak at $2.297 — moderate volatility and early-day strength have given way to renewed downward pressure. Momentum readings are mixed, and the 5.94% gain driven by the gap is not strongly confirmed by oscillators.
Limited upside outlook as technical signals reinforce downside bias
For the next five trading days, DOT’s expected price range is $2.10 to $2.59, reflecting typical volatility relative to current levels. With all four weekly indicators (RSI, ADX, MACD, MA-50) classified as 'Sell,' the chance of an upward breakout is low (below 20%), and further downside is likely. Baseline scenario: DOT trades sideways within the $2.10 to $2.59 band. A bullish turn requires a sustained move above $2.46 – $2.59, while a close below $2.10 would focus attention on new lows amid persistent seller control.
Previously it was reported that Polkadot persisted below key moving averages, with technical indicators including a low RSI, weak MACD, and ongoing bearish pressure constraining price action. Short-term oscillators showed some divergence, but the probability of a price increase remained low as the asset traded near support and faced resistance from sellers.


Latest Polkadot News


-
 Afghanistan
-
 Albania
-
 Algeria
-
 Angola
-
 Argentina
-
 Armenia
-
 Australia
-
 Austria
-
 Azerbaijan
-
 Bahamas
-
 Bahrain
-
 Bangladesh
-
 Belarus
-
 Belgium
-
 Bolivia
-
 Botswana
-
 Brazil
-
 Brunei
-
 Bulgaria
-
 Cambodia
-
 Cameroon
-
 Canada
-
 Chile
Chile
-
 China
China
-
 Colombia
-
 Congo
Congo
-
 Costa Rica
-
 Cote d'Ivoire
-
 Croatia
-
 Cuba
Cuba
-
 Cyprus
-
 Czechia
-
 DR Congo
-
 Denmark
-
 Dominican Republic
-
 Ecuador
-
 Egypt
Egypt
-
 El Salvador
-
 Estonia
-
 Eswatini
-
 Ethiopia
-
 Finland
-
 France
-
 Georgia
-
 Germany
-
 Ghana
Ghana
-
 Greece
-
 Haiti
Haiti
-
 Hong Kong
-
 Hungary
-
 India
India
-
 Indonesia
-
 Iran, Islamic republic
-
 Iraq
Iraq
-
 Ireland
-
 Israel
-
 Italy
Italy
-
 Jamaica
-
 Japan
Japan
-
 Jordan
-
 Kazakhstan
-
 Kenya
Kenya
-
 Korea
Korea
-
 Kuwait
-
 Kyrgyzstan
-
 Laos
Laos
-
 Latvia
-
 Lebanon
-
 Lesotho
-
 Libya
Libya
-
 Lithuania
-
 Luxembourg
-
 Madagascar
-
 Malaysia
-
 Malta
Malta
-
 Mauritius
-
 Mexico
-
 Moldova
-
 Mongolia
-
 Montenegro
-
 Morocco
-
 Mozambique
-
 Myanmar
-
 Namibia
-
 Nepal
Nepal
-
 Netherlands
-
 New Zealand
-
 Nigeria
-
 North Macedonia
-
 Norway
-
 Oman
Oman
-
 Pakistan
-
 Palestine
-
 Panama
-
 Papua New Guinea
-
 Paraguay
-
 Peru
Peru
-
 Philippines
-
 Poland
-
 Portugal
-
 Puerto Rico
-
 Qatar
Qatar
-
 Reunion
-
 Romania
-
 Rwanda
-
 Saudi Arabia
-
 Serbia
-
 Singapore
-
 Slovakia
-
 Slovenia
-
 Somalia
-
 South Africa
-
 Spain
Spain
-
 Sri Lanka
-
 Sweden
-
 Switzerland
-
 Syria
Syria
-
 Taiwan
-
 Tajikistan
-
 Tanzania
-
 Thailand
-
 Trinidad and Tobago
-
 Tunisia
-
 Turkey
-
 UAE
UAE
-
 Uganda
-
 Ukraine
-
 United Kingdom
-
United States
-
 Uruguay
-
 Uzbekistan
-
 Venezuela
-
 Vietnam
-
 Yemen
Yemen
-
 Zambia
-
 Zimbabwe
- Forex
- Crypto
