
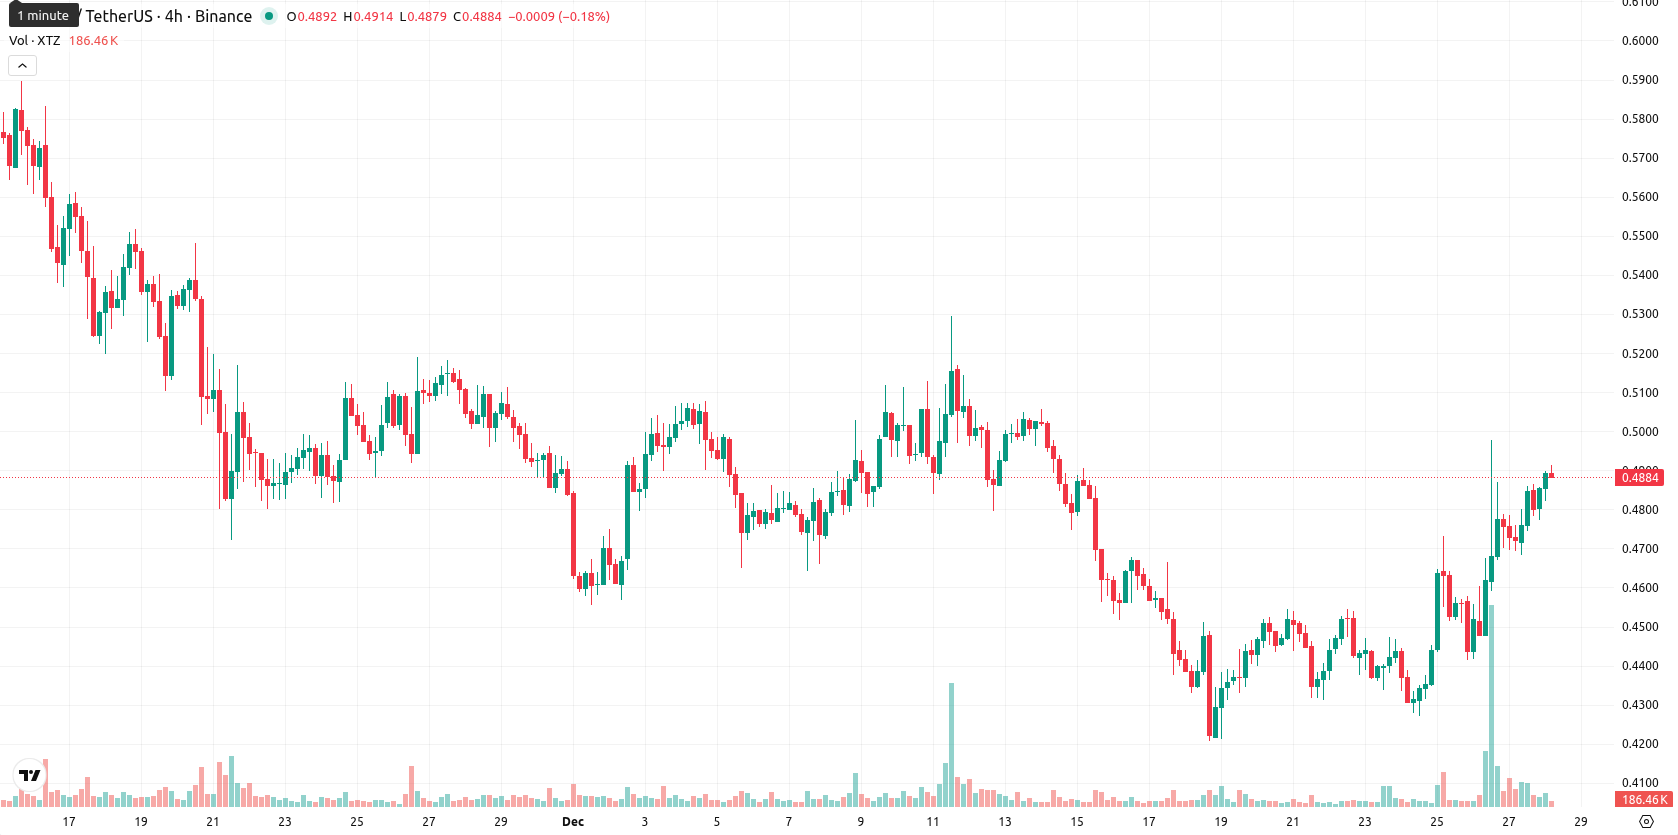
Tezos: buyers dominate but oscillators warn of pullback as price gains 9.16%

Tezos (XTZ) is trading at $0.5149, above the MA-20 ($0.4677) and MA-50 ($0.5036), but well below the long-term MA-200 ($0.6439). This positioning reflects short-term bullish momentum, moderate strength over the medium term, but a persistent long-term bearish backdrop as the price remains under its MA-200; dynamic support is seen near the Ichimoku Kijun ($0.4750), with the MA-50 acting as the closest resistance should upward momentum stall.
Highlights
- XTZ trades at $0.5149, up 9.16% from the previous close, positioned above the MA-20 ($0.4677) and MA-50 ($0.5036), but remains below the MA-200 ($0.6439) signaling long-term bearishness.
- Daily technical indicators are mixed, with MACD indicating a strong sell and Stoch RSI overbought, but RSI, CCI, and Bull/Bear Power showing strong buying pressure amid elevated volatility.
- For the next five trading days, XTZ is expected to stay range-bound between $0.4740 and $0.5253, with less than 20% probability of further price increases and a higher likelihood of decline.
Conflicting momentum signals amid strong intraday buying
Momentum indicators on the daily chart provide conflicting signals. MACD points to a strong sell, while ADX reflects a weak trend, but RSI, CCI, and Bull/Bear Power all show buyers dominating and upward pressure. The Stoch RSI is overbought, and CCI is elevated, indicating caution for potential short-term pullbacks despite high daily enthusiasm. The current price has rallied 9.16% from the previous close, opening near $0.4851 without a notable gap, and is now trading near today’s high of $0.5172, reflecting high volatility and strong intraday buying pressure. Oscillators are mixed — while intraday momentum confirms today’s strength, overbought signals warn of a possible pause.
Downside favored as breakout odds remain limited
For the next five trading days, the expected price range is $0.4740 to $0.5253. The probability of further price increases is very low (less than 20%), making a decline more likely as weekly indicators remain cautious or bearish. The baseline scenario is for price action to hold within a sideways corridor between these levels. A bullish scenario would require a sustained breakout above $0.5253, while a bearish move would be a drop below $0.4740, re-testing key recent supports.
Previously it was reported that Tezos (XTZ) is showing short-term bullish momentum above the 20-day moving average, though it remains below the 50-day and 200-day MAs, indicating ongoing medium- and long-term resistance. Key technical indicators are mixed—RSI is modestly bullish, Stoch RSI is overbought, MACD signals selling pressure, and with support near $0.4750 and resistance at the 50-day MA, consolidation within a narrow range is expected while overall downside risks persist.


-
 Afghanistan
-
 Albania
-
 Algeria
-
 Angola
-
 Argentina
-
 Armenia
-
 Australia
-
 Austria
-
 Azerbaijan
-
 Bahamas
-
 Bahrain
-
 Bangladesh
-
 Belarus
-
 Belgium
-
 Bolivia
-
 Botswana
-
 Brazil
-
 Brunei
-
 Bulgaria
-
 Cambodia
-
 Cameroon
-
 Canada
-
 Chile
Chile
-
 China
China
-
 Colombia
-
 Congo
Congo
-
 Costa Rica
-
 Cote d'Ivoire
-
 Croatia
-
 Cuba
Cuba
-
 Cyprus
-
 Czechia
-
 DR Congo
-
 Denmark
-
 Dominican Republic
-
 Ecuador
-
 Egypt
Egypt
-
 El Salvador
-
 Estonia
-
 Eswatini
-
 Ethiopia
-
 Finland
-
 France
-
 Georgia
-
 Germany
-
 Ghana
Ghana
-
 Greece
-
 Haiti
Haiti
-
 Hong Kong
-
 Hungary
-
 India
India
-
 Indonesia
-
 Iran, Islamic republic
-
 Iraq
Iraq
-
 Ireland
-
 Israel
-
 Italy
Italy
-
 Jamaica
-
 Japan
Japan
-
 Jordan
-
 Kazakhstan
-
 Kenya
Kenya
-
 Korea
Korea
-
 Kuwait
-
 Kyrgyzstan
-
 Laos
Laos
-
 Latvia
-
 Lebanon
-
 Lesotho
-
 Libya
Libya
-
 Lithuania
-
 Luxembourg
-
 Madagascar
-
 Malaysia
-
 Malta
Malta
-
 Mauritius
-
 Mexico
-
 Moldova
-
 Mongolia
-
 Montenegro
-
 Morocco
-
 Mozambique
-
 Myanmar
-
 Namibia
-
 Nepal
Nepal
-
 Netherlands
-
 New Zealand
-
 Nigeria
-
 North Macedonia
-
 Norway
-
 Oman
Oman
-
 Pakistan
-
 Palestine
-
 Panama
-
 Papua New Guinea
-
 Paraguay
-
 Peru
Peru
-
 Philippines
-
 Poland
-
 Portugal
-
 Puerto Rico
-
 Qatar
Qatar
-
 Reunion
-
 Romania
-
 Rwanda
-
 Saudi Arabia
-
 Serbia
-
 Singapore
-
 Slovakia
-
 Slovenia
-
 Somalia
-
 South Africa
-
 Spain
Spain
-
 Sri Lanka
-
 Sweden
-
 Switzerland
-
 Syria
Syria
-
 Taiwan
-
 Tajikistan
-
 Tanzania
-
 Thailand
-
 Trinidad and Tobago
-
 Tunisia
-
 Turkey
-
 UAE
UAE
-
 Uganda
-
 Ukraine
-
 United Kingdom
-
United States
-
 Uruguay
-
 Uzbekistan
-
 Venezuela
-
 Vietnam
-
 Yemen
Yemen
-
 Zambia
-
 Zimbabwe
- Forex
- Crypto
