
Avalanche price prediction: Overbought conditions signal caution as AVAX trades near $14

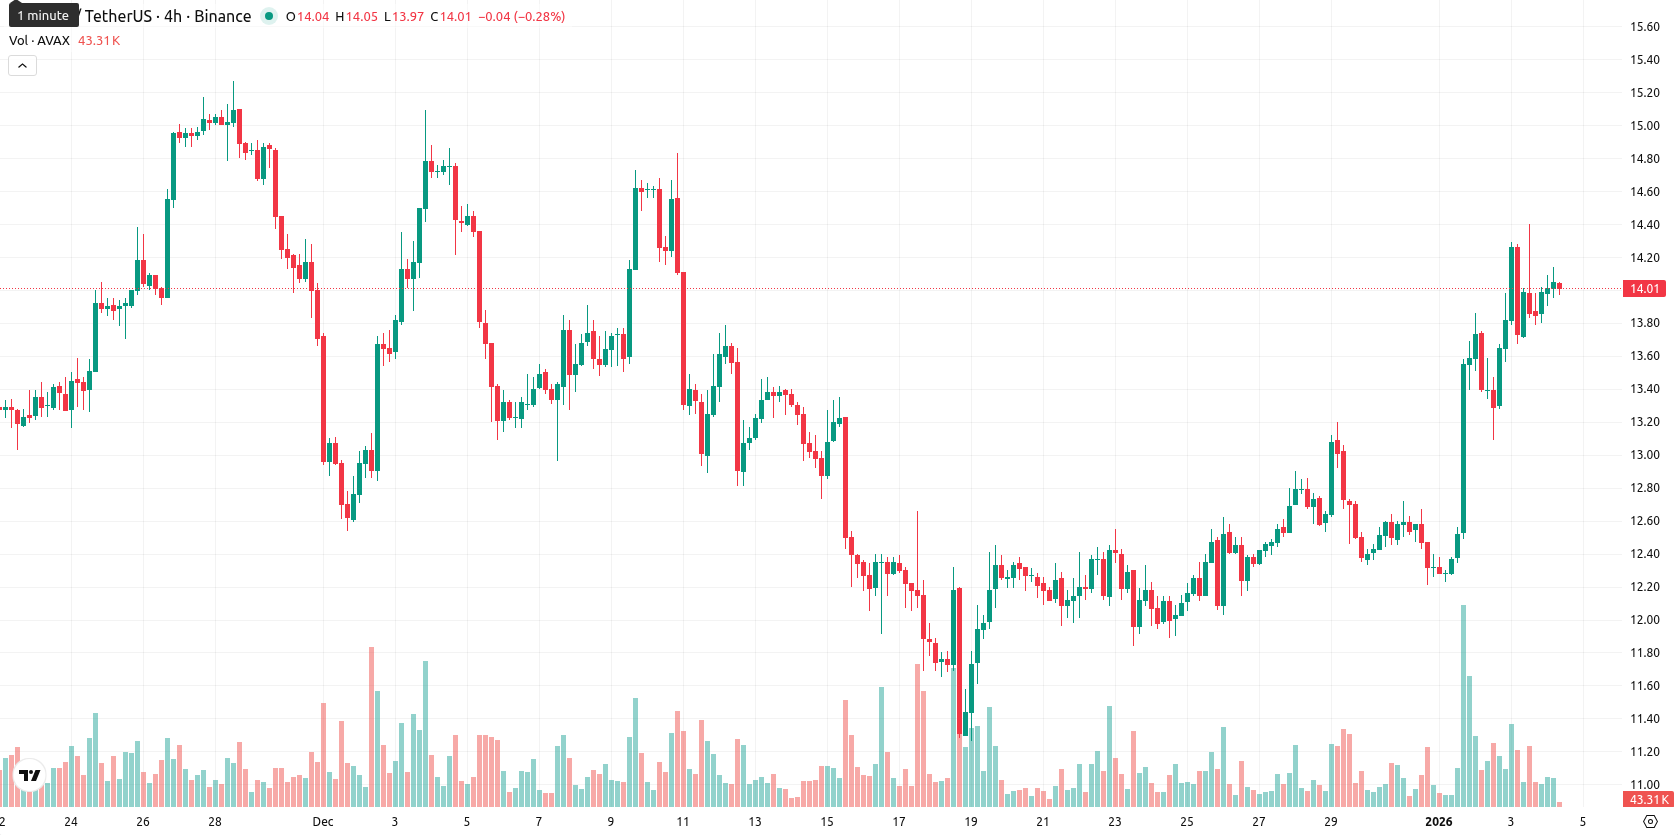
Avalanche (AVAX) is trading at $14.11, which is above both its MA-20 ($12.49) and MA-50 ($13.38), indicating strength in the short- and medium-term trends, but remains well below its MA-200 ($20.71), suggesting long-term resistance persists.
Highlights
- Avalanche's C-Chain surpassed 400 million transactions in the past year, while daily active users reached approximately 810,000, signaling robust ecosystem growth.
- The Avalanche network achieved an all-time high in smart contracts deployed, holds nearly $950 million in real-world assets, and has burned almost 5 million AVAX to date.
- Grayscale amended its spot AVAX ETF filing to potentially allocate up to 70% of fund assets to staking, pending regulatory approval.
Network expansion and ETF developments drive institutional optimism
Avalanche's network continues to expand rapidly, with its C-Chain processing over 400 million transactions in a year and daily active users reaching around 810,000. The ecosystem has set an all-time high in smart contracts deployed, holds nearly $950 million in real-world asset value, and has burned almost 5 million AVAX to date, helping enforce the platform's maximum supply of 720 million AVAX. Grayscale has updated its spot AVAX ETF filing to potentially allow up to 70% of fund assets to be staked, contingent on regulatory approval.
Buyer momentum persists as overbought signals prompt caution
The nearest dynamic support is around the Ichimoku Kijun at $13.05, while the next resistance level is seen at the MA-50 ($13.38), with no golden or death cross present. Momentum on the daily timeframe is moderately constructive, as ADX shows a clear upward bias and MACD remains neutral. Several oscillators, including the RSI and CCI, indicate overbought conditions, and Bull/Bear Power signals buyers are currently dominant. The Awesome Oscillator supports bullish momentum, with AVAX trading near the high end of the $13.90 – $14.09 intraday range, highlighting low volatility and persistent strength. However, the combination of strong buyer momentum and overbought signals suggests that caution is warranted.
Limited upside expected as short-term momentum fades
For the next 5 trading days, AVAX is expected to trade within a typical volatility band between $13.40 and $14.80. The probability of a further price increase is very low (less than 20%), meaning a decline or sideways movement is more likely as short-term momentum fades and buyers consolidate. In the baseline scenario, AVAX holds within this range, but a bullish move above $14.80 could occur if buying resumes, while a break below $13.40 would expose the price to deeper retracement toward previous support.
Previously it was reported that Avalanche continues to trade above its short- and medium-term moving averages, with institutional support rising on ETF developments, but remains capped by long-term resistance amid robust network activity. While short-term momentum indicators are mixed and oscillators signal overbought conditions near key resistance, bearish weekly signals and modest RSI suggest limited upside and rising risk of a near-term retracement if support levels fail.


Latest Avalanche News


-
 Afghanistan
-
 Albania
-
 Algeria
-
 Angola
-
 Argentina
-
 Armenia
-
 Australia
-
 Austria
-
 Azerbaijan
-
 Bahamas
-
 Bahrain
-
 Bangladesh
-
 Belarus
-
 Belgium
-
 Bolivia
-
 Botswana
-
 Brazil
-
 Brunei
-
 Bulgaria
-
 Cambodia
-
 Cameroon
-
 Canada
-
 Chile
Chile
-
 China
China
-
 Colombia
-
 Congo
Congo
-
 Costa Rica
-
 Cote d'Ivoire
-
 Croatia
-
 Cuba
Cuba
-
 Cyprus
-
 Czechia
-
 DR Congo
-
 Denmark
-
 Dominican Republic
-
 Ecuador
-
 Egypt
Egypt
-
 El Salvador
-
 Estonia
-
 Eswatini
-
 Ethiopia
-
 Finland
-
 France
-
 Georgia
-
 Germany
-
 Ghana
Ghana
-
 Greece
-
 Haiti
Haiti
-
 Hong Kong
-
 Hungary
-
 India
India
-
 Indonesia
-
 Iran, Islamic republic
-
 Iraq
Iraq
-
 Ireland
-
 Israel
-
 Italy
Italy
-
 Jamaica
-
 Japan
Japan
-
 Jordan
-
 Kazakhstan
-
 Kenya
Kenya
-
 Korea
Korea
-
 Kuwait
-
 Kyrgyzstan
-
 Laos
Laos
-
 Latvia
-
 Lebanon
-
 Lesotho
-
 Libya
Libya
-
 Lithuania
-
 Luxembourg
-
 Madagascar
-
 Malaysia
-
 Malta
Malta
-
 Mauritius
-
 Mexico
-
 Moldova
-
 Mongolia
-
 Montenegro
-
 Morocco
-
 Mozambique
-
 Myanmar
-
 Namibia
-
 Nepal
Nepal
-
 Netherlands
-
 New Zealand
-
 Nigeria
-
 North Macedonia
-
 Norway
-
 Oman
Oman
-
 Pakistan
-
 Palestine
-
 Panama
-
 Papua New Guinea
-
 Paraguay
-
 Peru
Peru
-
 Philippines
-
 Poland
-
 Portugal
-
 Puerto Rico
-
 Qatar
Qatar
-
 Reunion
-
 Romania
-
 Rwanda
-
 Saudi Arabia
-
 Serbia
-
 Singapore
-
 Slovakia
-
 Slovenia
-
 Somalia
-
 South Africa
-
 Spain
Spain
-
 Sri Lanka
-
 Sweden
-
 Switzerland
-
 Syria
Syria
-
 Taiwan
-
 Tajikistan
-
 Tanzania
-
 Thailand
-
 Trinidad and Tobago
-
 Tunisia
-
 Turkey
-
 UAE
UAE
-
 Uganda
-
 Ukraine
-
 United Kingdom
-
United States
-
 Uruguay
-
 Uzbekistan
-
 Venezuela
-
 Vietnam
-
 Yemen
Yemen
-
 Zambia
-
 Zimbabwe
- Forex
- Crypto
