
Steady action for Polkadot — indecisive trends drive quiet trading

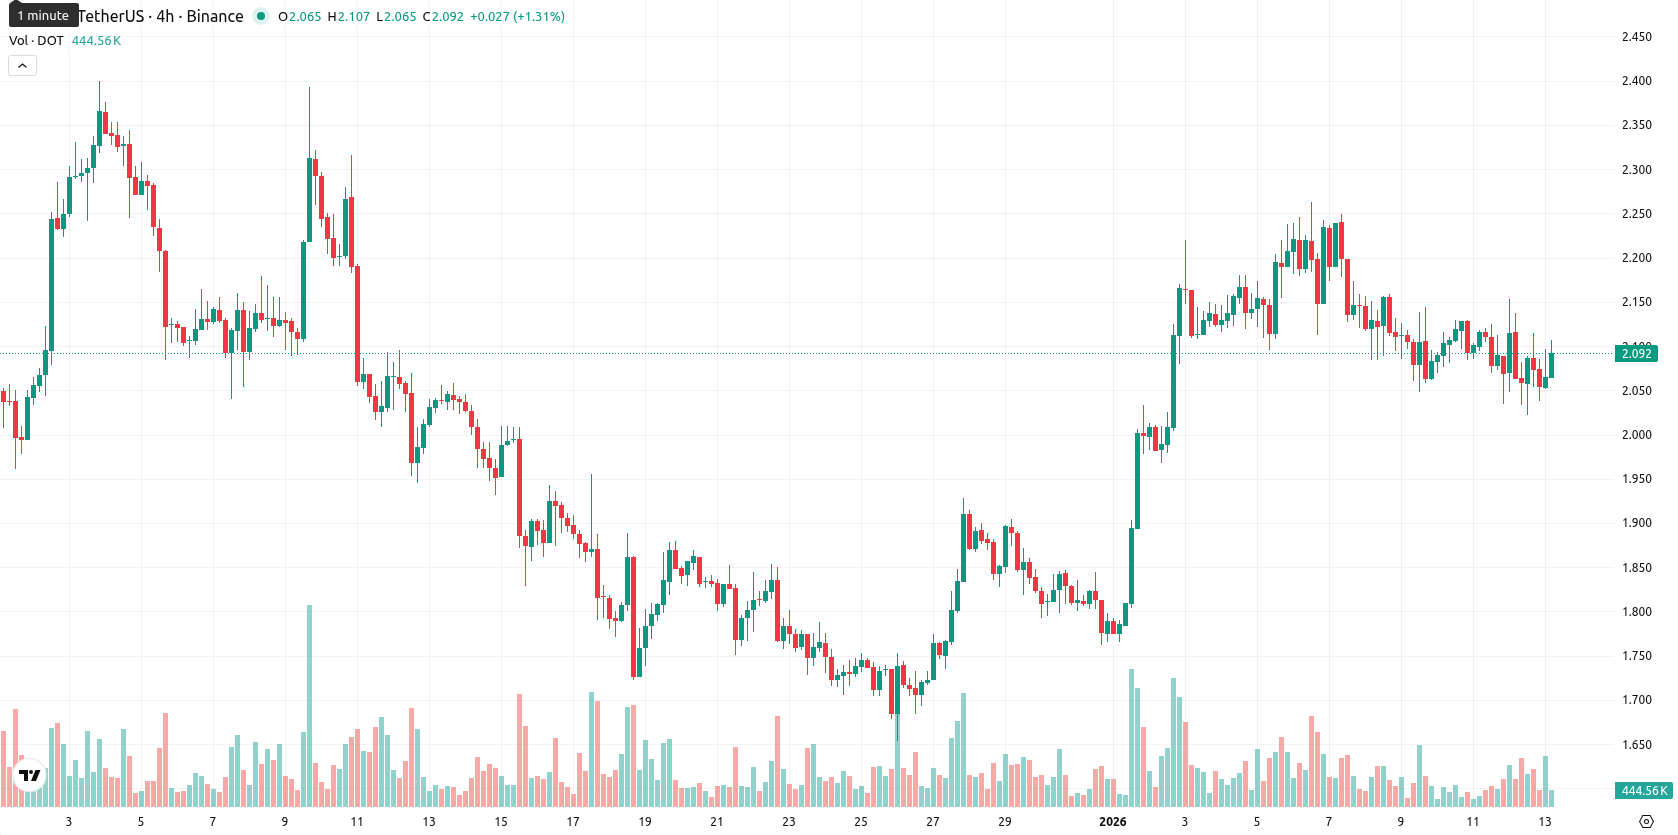
Polkadot (DOT) is trading at $2.092, above its MA-20 ($1.988) and MA-50 ($2.044) but still well below the MA-200 ($3.246). This pattern points to mild short-term bullish momentum, though the broader trend continues to face pressure from sellers.
Highlights
- At the current price of $2.092, DOT trades above the MA-20 ($1.988) and MA-50 ($2.044), signaling some short-term bullish momentum but remains well below the MA-200 ($3.246).
- Daily technical indicators show mixed signals: the MACD supports mild upward momentum, but the ADX and oscillators suggest weak trends and possible sideways consolidation.
- DOT is expected to trade between $1.88 and $2.20 over the next five trading days, with a less than 20% probability of a significant upward move and a higher likelihood of price consolidation or decline.
Steady network activity as no major catalysts emerge for DOT
The Polkadot blockchain continues to be recognized for its interoperability solutions and decentralized governance, with DOT maintaining its role as the network's governance and staking token overseen by the Web3 Foundation. Activity on the network remains steady, evidenced by $137 million in daily trading volume and a total market capitalization of about $3.41 billion. No significant corporate actions, regulatory changes, or ecosystem upgrades have been confirmed in recent days.
Mixed momentum signals as DOT consolidates near technical supports
Technically, DOT finds its nearest dynamic support at the Ichimoku Kijun ($1.958), with immediate short-term support at the MA-50 ($2.044); no MA-50/MA-200 crossover is evident. Momentum signals are mixed: the MACD on the daily chart points to mild upward momentum, but the ADX signals a lack of strong trend, while RSI is just above 50 showing a neutral to slightly positive bias. Other oscillators — Stochastic RSI and Commodity Channel Index — do not indicate major extremes, and Bull/Bear Power remains positive, supporting minor intraday buyer dominance. DOT's daily change shows a modest slip of 0.71%, with prices near the midpoint of today’s range and low intraday volatility, aligning with sideways price consolidation after the open.
Limited upside as volatility band constrains short-term outlook
Over the next five trading days, DOT is expected to fluctuate in a $1.88 – $2.20 volatility band relative to current levels. There is less than a 20% probability of a strong upside breakout; weekly indicators point toward a higher likelihood of mild declines or continued sideways movement within this band. Continued upward movement would require a push above $2.20, while a drop below $1.88 could intensify selling pressure and test deeper support.
Last time, analysts noted that Polkadot is trading above its short- and medium-term moving averages but remains well below its long-term average, reflecting a short-term bullish bias within an overall long-term downtrend. Daily momentum signals are mixed with neutral RSI and weak trend indicators, suggesting that price action is likely to remain rangebound between support near $1.97 and resistance in the $2.15–$2.29 area unless a decisive directional move occurs.


Latest Polkadot News


-
 Afghanistan
-
 Albania
-
 Algeria
-
 Angola
-
 Argentina
-
 Armenia
-
 Australia
-
 Austria
-
 Azerbaijan
-
 Bahamas
-
 Bahrain
-
 Bangladesh
-
 Belarus
-
 Belgium
-
 Bolivia
-
 Botswana
-
 Brazil
-
 Brunei
-
 Bulgaria
-
 Cambodia
-
 Cameroon
-
 Canada
-
 Chile
Chile
-
 China
China
-
 Colombia
-
 Congo
Congo
-
 Costa Rica
-
 Cote d'Ivoire
-
 Croatia
-
 Cuba
Cuba
-
 Cyprus
-
 Czechia
-
 DR Congo
-
 Denmark
-
 Dominican Republic
-
 Ecuador
-
 Egypt
Egypt
-
 El Salvador
-
 Estonia
-
 Eswatini
-
 Ethiopia
-
 Finland
-
 France
-
 Georgia
-
 Germany
-
 Ghana
Ghana
-
 Greece
-
 Haiti
Haiti
-
 Hong Kong
-
 Hungary
-
 India
India
-
 Indonesia
-
 Iran, Islamic republic
-
 Iraq
Iraq
-
 Ireland
-
 Israel
-
 Italy
Italy
-
 Jamaica
-
 Japan
Japan
-
 Jordan
-
 Kazakhstan
-
 Kenya
Kenya
-
 Korea
Korea
-
 Kuwait
-
 Kyrgyzstan
-
 Laos
Laos
-
 Latvia
-
 Lebanon
-
 Lesotho
-
 Libya
Libya
-
 Lithuania
-
 Luxembourg
-
 Madagascar
-
 Malaysia
-
 Malta
Malta
-
 Mauritius
-
 Mexico
-
 Moldova
-
 Mongolia
-
 Montenegro
-
 Morocco
-
 Mozambique
-
 Myanmar
-
 Namibia
-
 Nepal
Nepal
-
 Netherlands
-
 New Zealand
-
 Nigeria
-
 North Macedonia
-
 Norway
-
 Oman
Oman
-
 Pakistan
-
 Palestine
-
 Panama
-
 Papua New Guinea
-
 Paraguay
-
 Peru
Peru
-
 Philippines
-
 Poland
-
 Portugal
-
 Puerto Rico
-
 Qatar
Qatar
-
 Reunion
-
 Romania
-
 Rwanda
-
 Saudi Arabia
-
 Serbia
-
 Singapore
-
 Slovakia
-
 Slovenia
-
 Somalia
-
 South Africa
-
 Spain
Spain
-
 Sri Lanka
-
 Sweden
-
 Switzerland
-
 Syria
Syria
-
 Taiwan
-
 Tajikistan
-
 Tanzania
-
 Thailand
-
 Trinidad and Tobago
-
 Tunisia
-
 Turkey
-
 UAE
UAE
-
 Uganda
-
 Ukraine
-
 United Kingdom
-
United States
-
 Uruguay
-
 Uzbekistan
-
 Venezuela
-
 Vietnam
-
 Yemen
Yemen
-
 Zambia
-
 Zimbabwe
- Forex
- Crypto
