
-7.55% for The Graph — downside risk grows amid weak recovery prospects

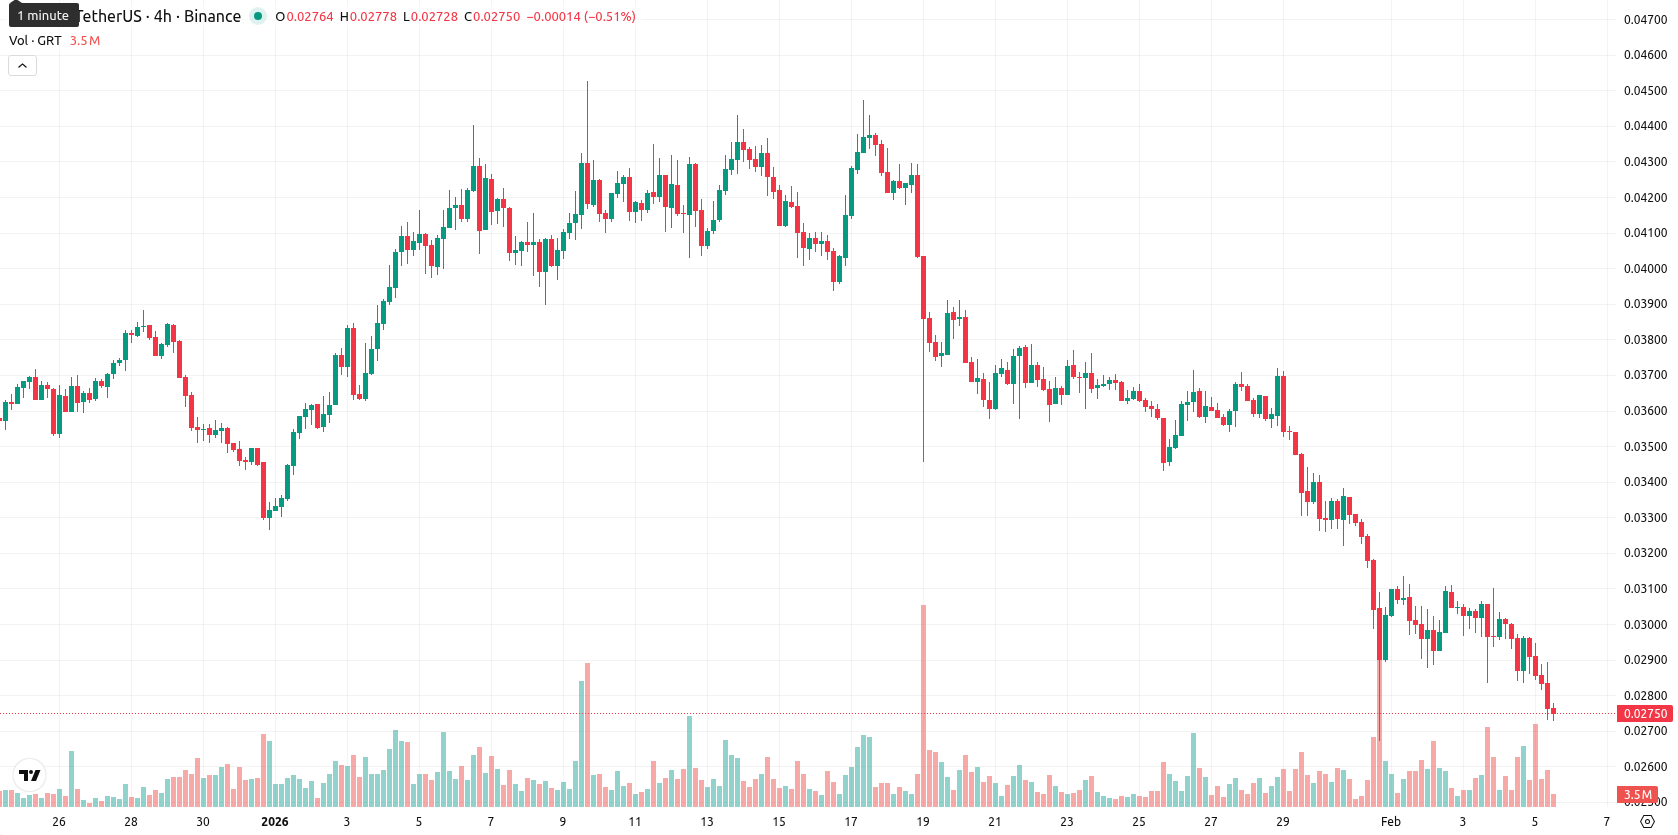
The Graph (GRT) is trading at $0.027373, down 7.55% for the day, and remains well below the MA-20 ($0.03533650), MA-50 ($0.03730440), and MA-200 ($0.06659055), signifying sustained downward momentum across all observed timeframes.
Highlights
- GRT is trading at $0.027373, significantly below MA-20 ($0.03533650), MA-50 ($0.03730440), and MA-200 ($0.06659055), confirming multi-timeframe bearish pressure.
- Momentum indicators (MACD, ADX) show ongoing sell signals and weak trend strength, with RSI, CCI, and Stochastic RSI all in oversold territory.
- For the next five trading days, GRT is highly likely (>80%) to trade between $0.02400 and $0.03000, with key resistance at $0.03572 and major support at $0.02400.
Bearish momentum persists as resistance and oversold signals align
The token continues to face technical headwinds with the Ichimoku indicator showing the nearest dynamic resistance at the Kijun level of $0.03572000, while short-term support is forming just under today's intraday low. Momentum measures, including the MACD and ADX, confirm a bearish inclination with weak trend strength, while the Relative Strength Index, Commodity Channel Index, and Stochastic RSI all highlight oversold conditions. Bull/Bear Power indicates sellers are in control throughout intraday sessions, and the Awesome Oscillator underscores the prevailing negative trend.
Further declines likely as volatility and downside risk intensify
Over the coming five trading days, the price is expected to fluctuate within a volatility band relative to current levels, projected between $0.02400 and $0.03000. There is a very high likelihood (greater than 80%) of continued declines, with limited prospects for a significant recovery. The base case outlook envisions sideways price action within this band, while a move above the Ichimoku Kijun at $0.03572 would be needed for a bullish reversal. Conversely, a drop below $0.02400 could trigger further selling momentum.
Previously it was reported that The Graph remains in a bearish technical structure, trading well below all major moving averages with momentum indicators such as MACD, ADX, and the Awesome Oscillator reinforcing persistent seller dominance. While oversold signals from RSI and CCI suggest a possible short-term bounce, resistance at the Ichimoku Kijun limits upside potential and the asset is expected to consolidate within a narrow range barring a decisive breakout.


-
 Afghanistan
-
 Albania
-
 Algeria
-
 Angola
-
 Argentina
-
 Armenia
-
 Australia
-
 Austria
-
 Azerbaijan
-
 Bahamas
-
 Bahrain
-
 Bangladesh
-
 Belarus
-
 Belgium
-
 Bolivia
-
 Botswana
-
 Brazil
-
 Brunei
-
 Bulgaria
-
 Cambodia
-
 Cameroon
-
 Canada
-
 Chile
Chile
-
 China
China
-
 Colombia
-
 Congo
Congo
-
 Costa Rica
-
 Cote d'Ivoire
-
 Croatia
-
 Cuba
Cuba
-
 Cyprus
-
 Czechia
-
 DR Congo
-
 Denmark
-
 Dominican Republic
-
 Ecuador
-
 Egypt
Egypt
-
 El Salvador
-
 Estonia
-
 Eswatini
-
 Ethiopia
-
 Finland
-
 France
-
 Georgia
-
 Germany
-
 Ghana
Ghana
-
 Greece
-
 Haiti
Haiti
-
 Hong Kong
-
 Hungary
-
 India
India
-
 Indonesia
-
 Iran, Islamic republic
-
 Iraq
Iraq
-
 Ireland
-
 Israel
-
 Italy
Italy
-
 Jamaica
-
 Japan
Japan
-
 Jordan
-
 Kazakhstan
-
 Kenya
Kenya
-
 Korea
Korea
-
 Kuwait
-
 Kyrgyzstan
-
 Laos
Laos
-
 Latvia
-
 Lebanon
-
 Lesotho
-
 Libya
Libya
-
 Lithuania
-
 Luxembourg
-
 Madagascar
-
 Malaysia
-
 Malta
Malta
-
 Mauritius
-
 Mexico
-
 Moldova
-
 Mongolia
-
 Montenegro
-
 Morocco
-
 Mozambique
-
 Myanmar
-
 Namibia
-
 Nepal
Nepal
-
 Netherlands
-
 New Zealand
-
 Nigeria
-
 North Macedonia
-
 Norway
-
 Oman
Oman
-
 Pakistan
-
 Palestine
-
 Panama
-
 Papua New Guinea
-
 Paraguay
-
 Peru
Peru
-
 Philippines
-
 Poland
-
 Portugal
-
 Puerto Rico
-
 Qatar
Qatar
-
 Reunion
-
 Romania
-
 Rwanda
-
 Saudi Arabia
-
 Serbia
-
 Singapore
-
 Slovakia
-
 Slovenia
-
 Somalia
-
 South Africa
-
 Spain
Spain
-
 Sri Lanka
-
 Sweden
-
 Switzerland
-
 Syria
Syria
-
 Taiwan
-
 Tajikistan
-
 Tanzania
-
 Thailand
-
 Trinidad and Tobago
-
 Tunisia
-
 Turkey
-
 UAE
UAE
-
 Uganda
-
 Ukraine
-
 United Kingdom
-
United States
-
 Uruguay
-
 Uzbekistan
-
 Venezuela
-
 Vietnam
-
 Yemen
Yemen
-
 Zambia
-
 Zimbabwe
- Forex
- Crypto
