
Weak momentum and seller pressure persist — The Graph drops 7.27%

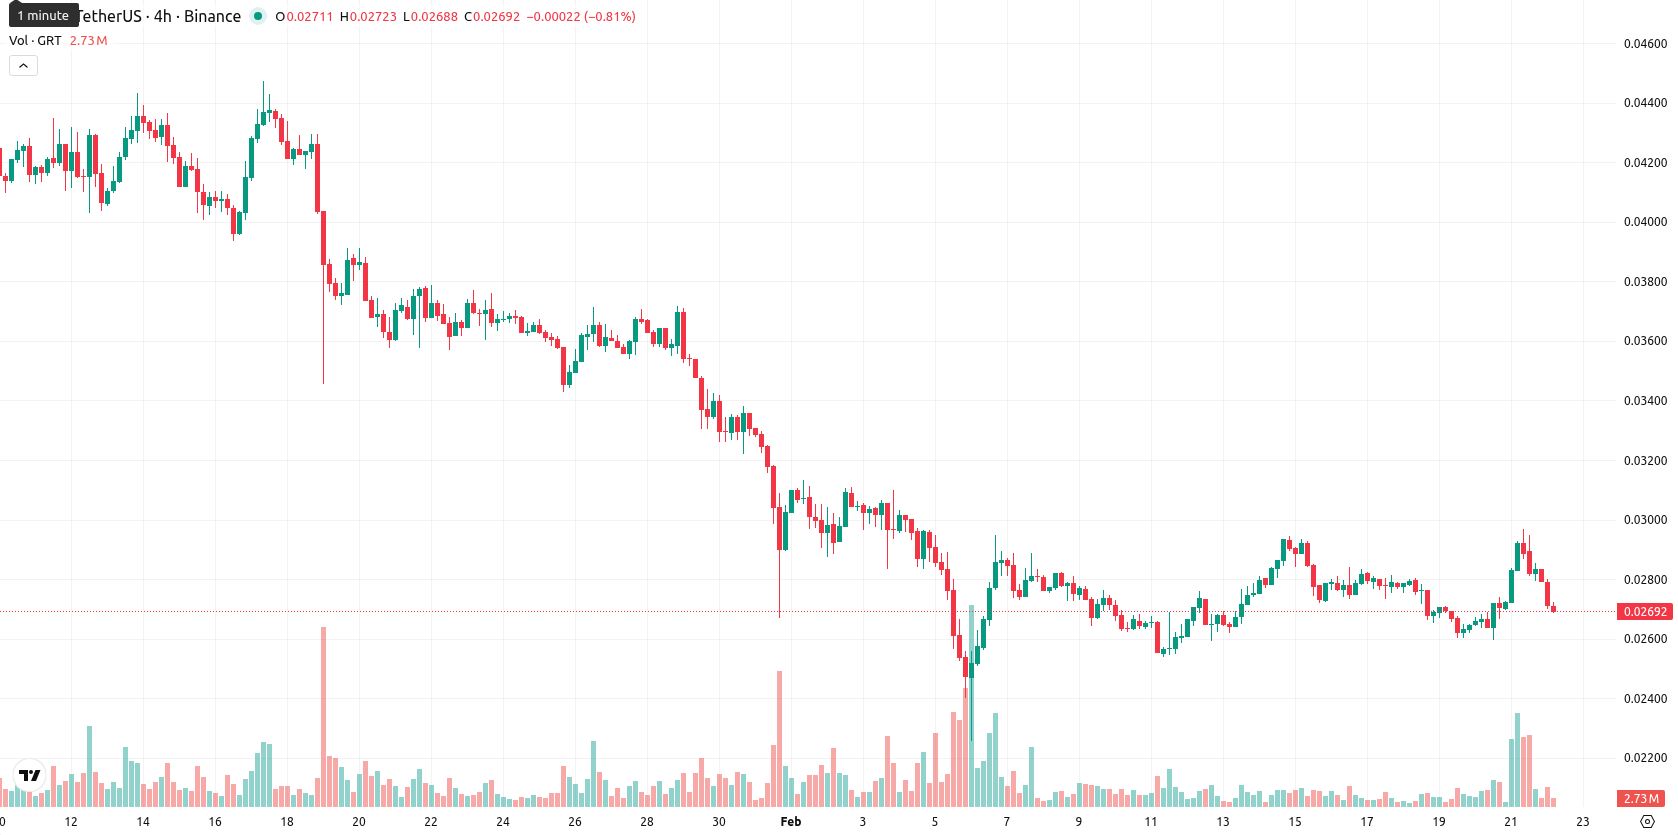
The Graph (GRT) is trading at $0.0269 after a daily drop of 7.27%. The asset remains below its MA-20 ($0.02768650), MA-50 ($0.03417700), and MA-200 ($0.06030150) levels, highlighting persistent seller pressure across all major timeframes.
Highlights
- GRT trades at $0.0269, below the MA-20 ($0.02768650), MA-50 ($0.03417700), and MA-200 ($0.06030150), reflecting strong seller control in all timeframes.
- Momentum is negative with both MACD and ADX on D1 supporting strong selling conditions, while RSI sits just above oversold levels and Stochastic RSI is at maximum overbought.
- Key resistance is at $0.02987 (Ichimoku Kijun), with the probability of a short-term price increase below 20% and further downside likely if $0.024 support breaks.
Overhead resistance and mixed signals define bearish momentum
From a technical perspective, GRT faces overhead resistance at the Ichimoku Kijun line of $0.02987, with momentum indicators such as MACD and ADX on the daily chart emphasizing a strong selling environment. The RSI is just above oversold, while the Stochastic RSI is at its overbought extreme, hinting at the potential for a reversal despite no clear sign of one. The Bull/Bear Power indicator marginally favors buyers on the day, but price action near the intraday low and high volatility highlight lingering downside pressure. Indicator signals are mixed, but the overall momentum confirms the day's sharp downside movement.
Lower consolidation favored as weakness persists across weekly signals
In the short term, GRT is expected to trade within a $0.024 to $0.029 volatility band relative to current levels, reflecting typical price swings for the asset. The probability of a short-term upward move is less than 20%, as all major weekly indicators continue to signal weakness. The baseline scenario is a consolidation within this lower corridor. If a sustained breakout above $0.02987 occurs, it could trigger a move towards $0.029, while a drop below $0.024 may lead to further downside with minimal nearby support.
Previously it was reported that The Graph (GRT) has rebounded above its 20-day moving average, showing strong daily gains despite remaining below key longer-term averages and within a broader bearish trend. While intraday momentum signals buyer strength, mixed oscillator readings and strong bearish momentum suggest the recent bullish move may be short-lived unless GRT decisively surpasses the immediate resistance at the Ichimoku Kijun line.


-
 Afghanistan
-
 Albania
-
 Algeria
-
 Angola
-
 Argentina
-
 Armenia
-
 Australia
-
 Austria
-
 Azerbaijan
-
 Bahamas
-
 Bahrain
-
 Bangladesh
-
 Belarus
-
 Belgium
-
 Bolivia
-
 Botswana
-
 Brazil
-
 Brunei
-
 Bulgaria
-
 Cambodia
-
 Cameroon
-
 Canada
-
 Chile
Chile
-
 China
China
-
 Colombia
-
 Congo
Congo
-
 Costa Rica
-
 Cote d'Ivoire
-
 Croatia
-
 Cuba
Cuba
-
 Cyprus
-
 Czechia
-
 DR Congo
-
 Denmark
-
 Dominican Republic
-
 Ecuador
-
 Egypt
Egypt
-
 El Salvador
-
 Estonia
-
 Eswatini
-
 Ethiopia
-
 Finland
-
 France
-
 Georgia
-
 Germany
-
 Ghana
Ghana
-
 Greece
-
 Haiti
Haiti
-
 Hong Kong
-
 Hungary
-
 India
India
-
 Indonesia
-
 Iran, Islamic republic
-
 Iraq
Iraq
-
 Ireland
-
 Israel
-
 Italy
Italy
-
 Jamaica
-
 Japan
Japan
-
 Jordan
-
 Kazakhstan
-
 Kenya
Kenya
-
 Korea
Korea
-
 Kuwait
-
 Kyrgyzstan
-
 Laos
Laos
-
 Latvia
-
 Lebanon
-
 Lesotho
-
 Libya
Libya
-
 Lithuania
-
 Luxembourg
-
 Madagascar
-
 Malaysia
-
 Malta
Malta
-
 Mauritius
-
 Mexico
-
 Moldova
-
 Mongolia
-
 Montenegro
-
 Morocco
-
 Mozambique
-
 Myanmar
-
 Namibia
-
 Nepal
Nepal
-
 Netherlands
-
 New Zealand
-
 Nigeria
-
 North Macedonia
-
 Norway
-
 Oman
Oman
-
 Pakistan
-
 Palestine
-
 Panama
-
 Papua New Guinea
-
 Paraguay
-
 Peru
Peru
-
 Philippines
-
 Poland
-
 Portugal
-
 Puerto Rico
-
 Qatar
Qatar
-
 Reunion
-
 Romania
-
 Rwanda
-
 Saudi Arabia
-
 Serbia
-
 Singapore
-
 Slovakia
-
 Slovenia
-
 Somalia
-
 South Africa
-
 Spain
Spain
-
 Sri Lanka
-
 Sweden
-
 Switzerland
-
 Syria
Syria
-
 Taiwan
-
 Tajikistan
-
 Tanzania
-
 Thailand
-
 Trinidad and Tobago
-
 Tunisia
-
 Turkey
-
 UAE
UAE
-
 Uganda
-
 Ukraine
-
 United Kingdom
-
United States
-
 Uruguay
-
 Uzbekistan
-
 Venezuela
-
 Vietnam
-
 Yemen
Yemen
-
 Zambia
-
 Zimbabwe
- Forex
- Crypto
