
GRT drops 4.12% amid sustained weakness below key moving averages and bearish technical momentum – weekly outlook

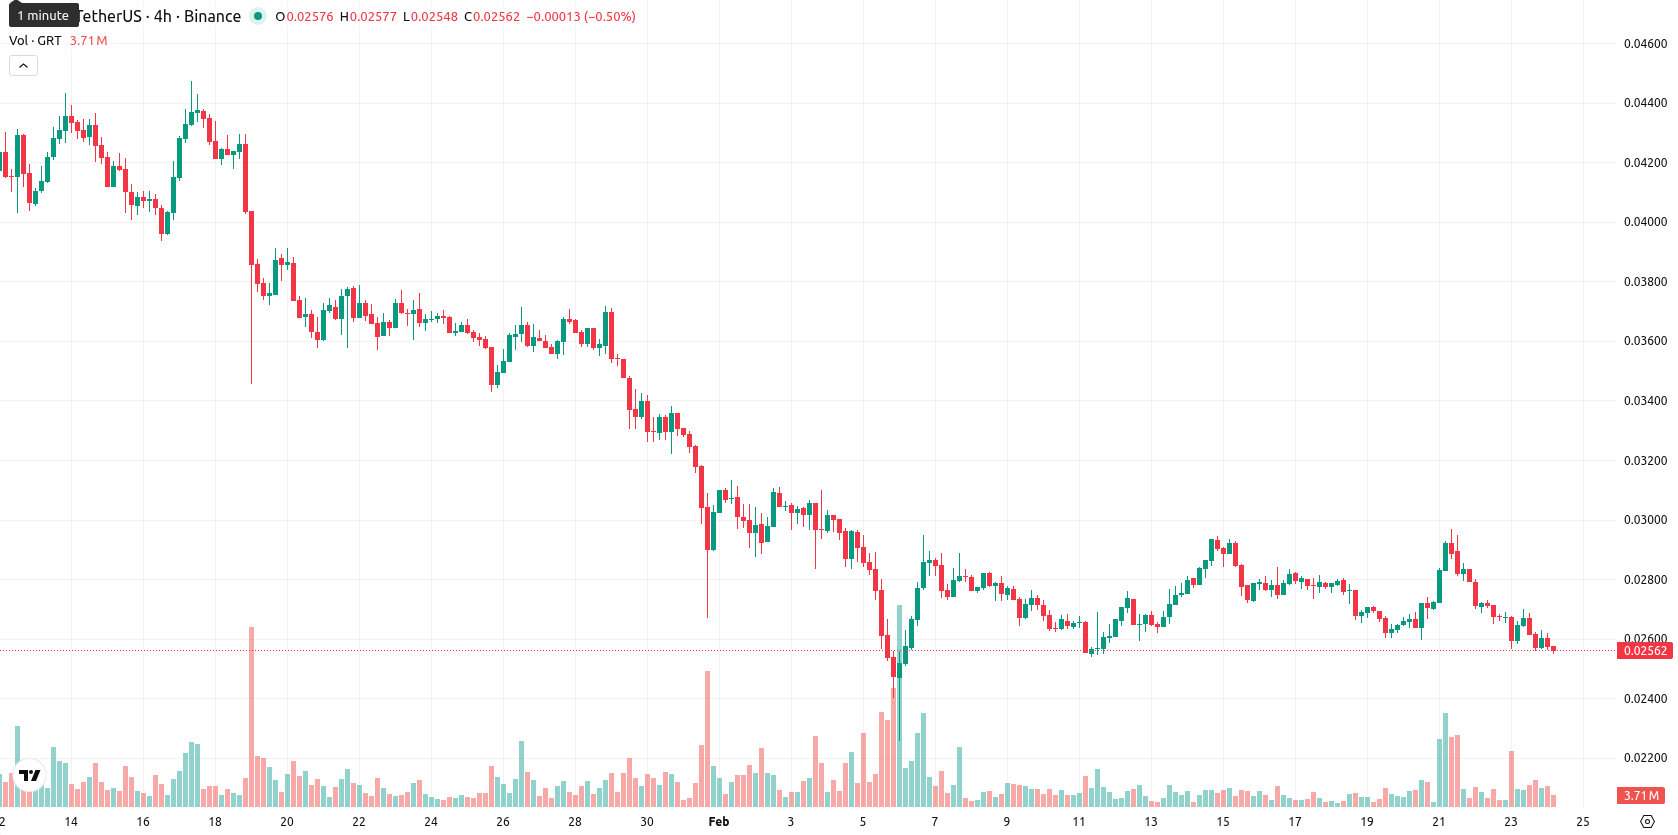
The Graph (GRT) is currently trading at $0.02564, marking a weekly decline as it remains below all major weekly moving averages — MA-20 ($0.02732), MA-50 ($0.03365), and MA-200 ($0.05963). This places GRT firmly in a short-, medium-, and long-term downtrend with negative momentum confirmed over the last week.
Highlights
- GRT is trading at $0.02564, remaining below the MA-20, MA-50, and MA-200, confirming short-, medium-, and long-term bearish trends.
- Momentum indicators—including MACD ('Strong Sell'), ADX, and negative Bull/Bear Power—signal robust, persistent selling pressure, with RSI (37.86) and CCI (-100) showing oversold conditions.
- The expected five-day trading range is $0.02300–$0.02750, with the Ichimoku Kijun resistance at $0.02983 and a baseline scenario of sideways or further downside movement.
Bearish momentum intensifies with no weekly support evident
On the weekly timeframe, GRT continues to trade under significant pressure, confirmed by its persistent weakness below the MA-20, MA-50, and MA-200. The nearest dynamic resistance is at the Ichimoku Kijun of $0.02983, while no substantial support levels are evident above the current market price. Weekly momentum readings remain bearish, with the RSI at 37.86 signaling ongoing weakness and approaching oversold territory, and the CCI at -100 further indicating potential oversold conditions. Weekly Stochastic RSI trends are also pointing to oversold, while the broader momentum indicators (MACD, ADX, Bull/Bear Power) reinforce a predominantly bearish outlook.
Range-bound outlook as bearish momentum caps recovery prospects
For the upcoming 5–7 trading days, GRT is expected to remain range-bound between $0.02300 and $0.02750 as bearish momentum persists on the weekly chart. Forecast models and weekly indicators present a very low probability — less than 20% — for a meaningful price recovery, with the baseline scenario being continued sideways movement within the current range. Should upward momentum unexpectedly return, a breakout above the weekly resistance at $0.02983 would be required to shift the outlook. Conversely, a further increase in selling pressure may push GRT below $0.02300, making a continuation of the downtrend the most probable near-term outcome.
Last time, analysts noted that The Graph is trading below its major moving averages, with strong seller pressure confirmed by bearish momentum indicators such as MACD and ADX, and resistance established at the Ichimoku Kijun line. Despite mixed intraday signals and a near-oversold RSI, the asset is expected to consolidate within a lower trading range, as technicals across key timeframes highlight persistent weakness and limited upside probability.


-
 Afghanistan
-
 Albania
-
 Algeria
-
 Angola
-
 Argentina
-
 Armenia
-
 Australia
-
 Austria
-
 Azerbaijan
-
 Bahamas
-
 Bahrain
-
 Bangladesh
-
 Belarus
-
 Belgium
-
 Bolivia
-
 Botswana
-
 Brazil
-
 Brunei
-
 Bulgaria
-
 Cambodia
-
 Cameroon
-
 Canada
-
 Chile
Chile
-
 China
China
-
 Colombia
-
 Congo
Congo
-
 Costa Rica
-
 Cote d'Ivoire
-
 Croatia
-
 Cuba
Cuba
-
 Cyprus
-
 Czechia
-
 DR Congo
-
 Denmark
-
 Dominican Republic
-
 Ecuador
-
 Egypt
Egypt
-
 El Salvador
-
 Estonia
-
 Eswatini
-
 Ethiopia
-
 Finland
-
 France
-
 Georgia
-
 Germany
-
 Ghana
Ghana
-
 Greece
-
 Haiti
Haiti
-
 Hong Kong
-
 Hungary
-
 India
India
-
 Indonesia
-
 Iran, Islamic republic
-
 Iraq
Iraq
-
 Ireland
-
 Israel
-
 Italy
Italy
-
 Jamaica
-
 Japan
Japan
-
 Jordan
-
 Kazakhstan
-
 Kenya
Kenya
-
 Korea
Korea
-
 Kuwait
-
 Kyrgyzstan
-
 Laos
Laos
-
 Latvia
-
 Lebanon
-
 Lesotho
-
 Libya
Libya
-
 Lithuania
-
 Luxembourg
-
 Madagascar
-
 Malaysia
-
 Malta
Malta
-
 Mauritius
-
 Mexico
-
 Moldova
-
 Mongolia
-
 Montenegro
-
 Morocco
-
 Mozambique
-
 Myanmar
-
 Namibia
-
 Nepal
Nepal
-
 Netherlands
-
 New Zealand
-
 Nigeria
-
 North Macedonia
-
 Norway
-
 Oman
Oman
-
 Pakistan
-
 Palestine
-
 Panama
-
 Papua New Guinea
-
 Paraguay
-
 Peru
Peru
-
 Philippines
-
 Poland
-
 Portugal
-
 Puerto Rico
-
 Qatar
Qatar
-
 Reunion
-
 Romania
-
 Rwanda
-
 Saudi Arabia
-
 Serbia
-
 Singapore
-
 Slovakia
-
 Slovenia
-
 Somalia
-
 South Africa
-
 Spain
Spain
-
 Sri Lanka
-
 Sweden
-
 Switzerland
-
 Syria
Syria
-
 Taiwan
-
 Tajikistan
-
 Tanzania
-
 Thailand
-
 Trinidad and Tobago
-
 Tunisia
-
 Turkey
-
 UAE
UAE
-
 Uganda
-
 Ukraine
-
 United Kingdom
-
United States
-
 Uruguay
-
 Uzbekistan
-
 Venezuela
-
 Vietnam
-
 Yemen
Yemen
-
 Zambia
-
 Zimbabwe
- Forex
- Crypto
