
Avalanche price prediction: Will fresh adoption drive further upside? AVAX consolidates near $9.38

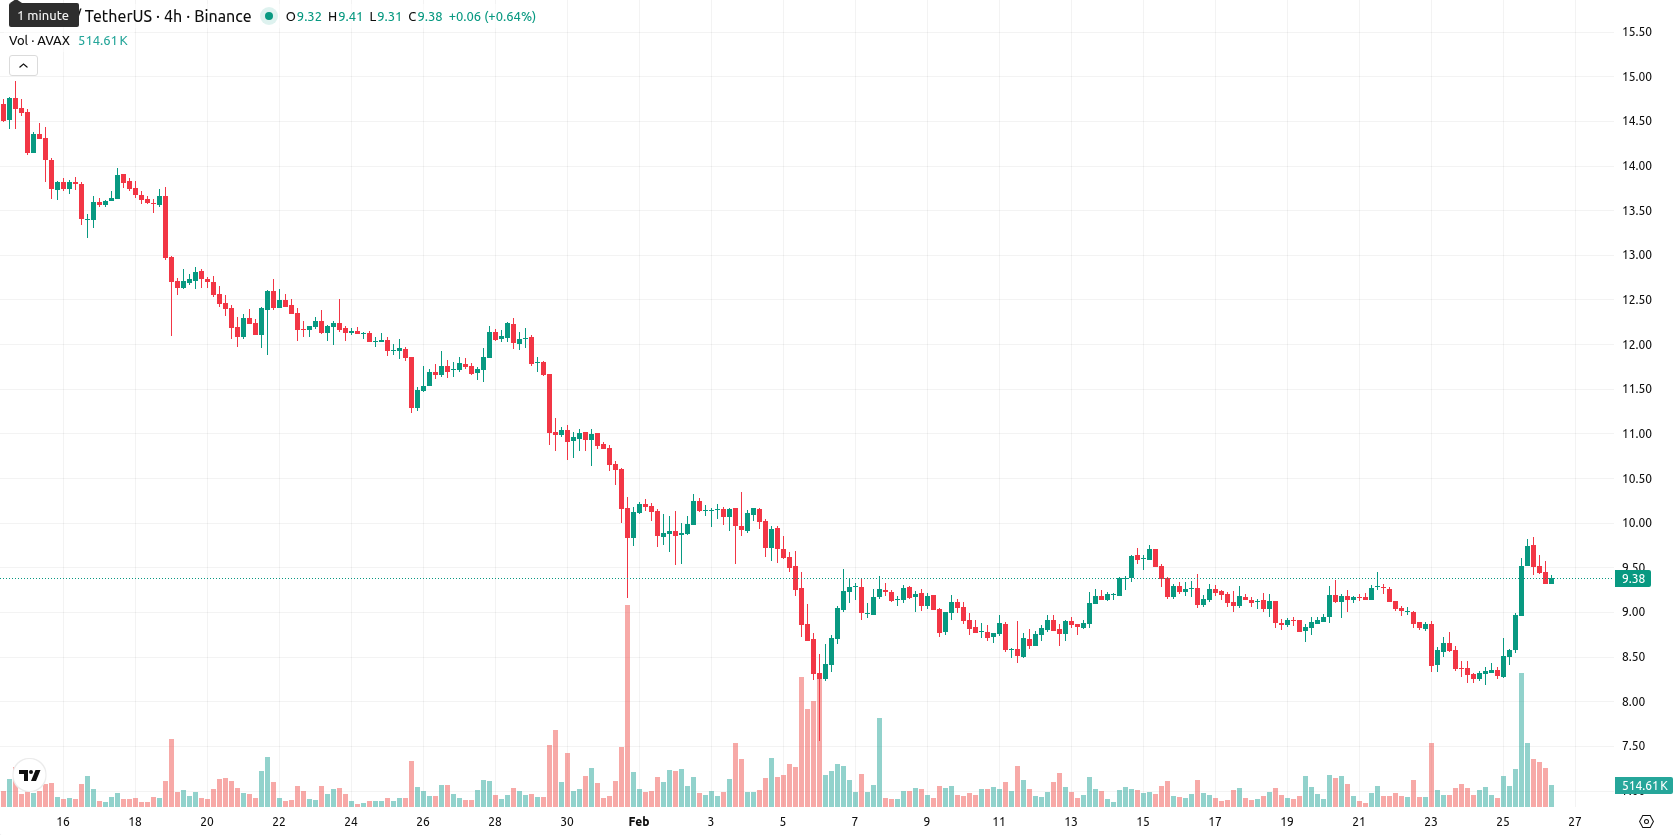
Avalanche (AVAX) is trading at $9.38, above both the MA-20 ($9.02) and well below the MA-50 ($10.96) and MA-200 ($18.10). This setup indicates short-term bullish momentum, but longer-term moving averages still signal prevailing medium- and long-term seller pressure, with the Ichimoku Kijun at $9.23 acting as immediate resistance.
Highlights
- Avalanche network activity is seeing robust ecosystem growth, fueled by enhanced Ethereum tool compatibility and increasing adoption by Web3 developers.
- The AVAX token underpins transaction fees and network security, with both adoption and investor interest rising alongside network development.
- AVAX trades at $9.38, above the MA-20 ($9.02), with immediate resistance at $9.23 and a likely weekly range of $8.45–$10.30, as technicals remain mixed.
Investor enthusiasm climbs as network adoption and Ethereum links grow
Recent activity on the Avalanche network demonstrates ecosystem growth, driven by increased compatibility with Ethereum’s development tools and support for millions of validators. The platform continues to be adopted by Web3 developers, with the AVAX token serving for transaction fees and network security. Growing adoption and network development are contributing to increased investor interest in Avalanche.
Mixed momentum signals as intraday volatility leads to consolidation
Momentum indicators on the daily chart are mixed: MACD signals strong bearish momentum while ADX points to a pronounced trend, but Stochastic RSI and Bull/Bear Power both register as overbought and emphasize buyer dominance. The RSI is below the midline at 49.78 and CCI remains positive but not extreme, signaling some short-term recovery even as risks of overextension persist. On the session, AVAX opened sharply higher (gap up from the $8.70 close to the $9.52 open), with the price near the middle of today's range ($9.31 – $9.63) after gaining 7.82%, highlighting high intraday volatility and some consolidation after early strength; signals from oscillators and momentum indicators remain divergent and suggest caution about trend continuation.
Downside risk prevails as weekly indicators warn of limited upside
For the next five trading days, the expected price range is adjusted to $8.45 to $10.30 to keep within typical weekly volatility bands around the current $9.38 level. The probability of a further price increase is very low (less than 20%), making a decline the more likely scenario given the consensus of major weekly indicators. The baseline scenario sees AVAX fluctuating sideways, while a bullish move requires a breakout above immediate resistance at $9.23 and a bearish scenario would be signaled by a push below $8.45 support.
Previously it was reported that Avalanche (AVAX) is exhibiting near-term buying activity as its price trades above the 20-day moving average but remains constrained below the 50- and 200-day averages, signaling an overall medium- and long-term bearish trend. Momentum indicators, including MACD and ADX, remain negative while oscillators reflect oversold conditions, with resistance identified near $9.32 and support around $8.00.


Latest Avalanche News


-
 Afghanistan
-
 Albania
-
 Algeria
-
 Angola
-
 Argentina
-
 Armenia
-
 Australia
-
 Austria
-
 Azerbaijan
-
 Bahamas
-
 Bahrain
-
 Bangladesh
-
 Belarus
-
 Belgium
-
 Bolivia
-
 Botswana
-
 Brazil
-
 Brunei
-
 Bulgaria
-
 Cambodia
-
 Cameroon
-
 Canada
-
 Chile
Chile
-
 China
China
-
 Colombia
-
 Congo
Congo
-
 Costa Rica
-
 Cote d'Ivoire
-
 Croatia
-
 Cuba
Cuba
-
 Cyprus
-
 Czechia
-
 DR Congo
-
 Denmark
-
 Dominican Republic
-
 Ecuador
-
 Egypt
Egypt
-
 El Salvador
-
 Estonia
-
 Eswatini
-
 Ethiopia
-
 Finland
-
 France
-
 Georgia
-
 Germany
-
 Ghana
Ghana
-
 Greece
-
 Haiti
Haiti
-
 Hong Kong
-
 Hungary
-
 India
India
-
 Indonesia
-
 Iran, Islamic republic
-
 Iraq
Iraq
-
 Ireland
-
 Israel
-
 Italy
Italy
-
 Jamaica
-
 Japan
Japan
-
 Jordan
-
 Kazakhstan
-
 Kenya
Kenya
-
 Korea
Korea
-
 Kuwait
-
 Kyrgyzstan
-
 Laos
Laos
-
 Latvia
-
 Lebanon
-
 Lesotho
-
 Libya
Libya
-
 Lithuania
-
 Luxembourg
-
 Madagascar
-
 Malaysia
-
 Malta
Malta
-
 Mauritius
-
 Mexico
-
 Moldova
-
 Mongolia
-
 Montenegro
-
 Morocco
-
 Mozambique
-
 Myanmar
-
 Namibia
-
 Nepal
Nepal
-
 Netherlands
-
 New Zealand
-
 Nigeria
-
 North Macedonia
-
 Norway
-
 Oman
Oman
-
 Pakistan
-
 Palestine
-
 Panama
-
 Papua New Guinea
-
 Paraguay
-
 Peru
Peru
-
 Philippines
-
 Poland
-
 Portugal
-
 Puerto Rico
-
 Qatar
Qatar
-
 Reunion
-
 Romania
-
 Rwanda
-
 Saudi Arabia
-
 Serbia
-
 Singapore
-
 Slovakia
-
 Slovenia
-
 Somalia
-
 South Africa
-
 Spain
Spain
-
 Sri Lanka
-
 Sweden
-
 Switzerland
-
 Syria
Syria
-
 Taiwan
-
 Tajikistan
-
 Tanzania
-
 Thailand
-
 Trinidad and Tobago
-
 Tunisia
-
 Turkey
-
 UAE
UAE
-
 Uganda
-
 Ukraine
-
 United Kingdom
-
United States
-
 Uruguay
-
 Uzbekistan
-
 Venezuela
-
 Vietnam
-
 Yemen
Yemen
-
 Zambia
-
 Zimbabwe
- Forex
- Crypto
