
Solana price prediction: Sideways trend persists? SOL trades below resistance despite ETF inflows

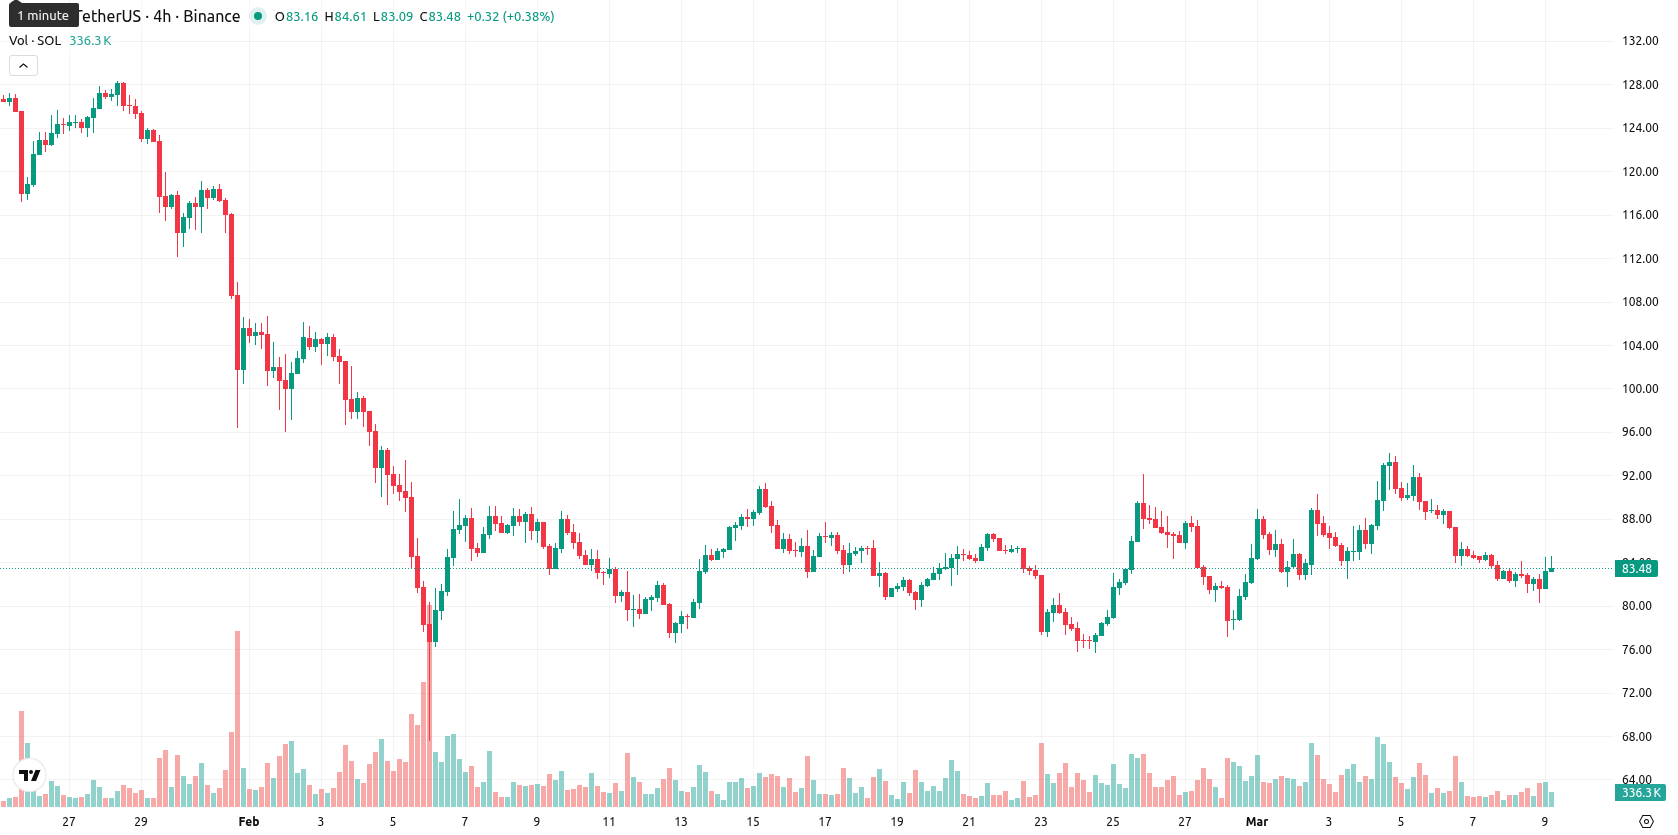
Solana (SOL) is trading at $83.50, which is below the MA-20 ($84.29), MA-50 ($96.81), and MA-200 ($153.36), indicating persistent short-, medium-, and long-term pressure from sellers. The Ichimoku Kijun level on the daily chart is $84.84, positioning it as immediate resistance, with no presence of a golden or death cross.
Highlights
- Solana has attracted about $1.5 billion in net inflows to US spot ETFs since launch, indicating strong institutional interest.
- The network posted a 755% year-over-year surge in payment volume, and Western Union will issue a stablecoin on Solana for treasury needs.
- SOL trades below major moving averages with technicals pointing to bearish momentum, forecasting a $75.00–$92.00 range and a sideways-to-downward bias over the next week.
Institutional inflows and payment surges drive ecosystem expansion
Solana has seen robust institutional inflows into spot ETFs, with cumulative net inflows reaching approximately $1.5 billion since launch and about $800 million in SOL now held collectively by US-based products. The network recorded a 755% year-over-year increase in payment volume, reflecting strong ecosystem usage. Solana's cumulative trading activity over the past three years has reached $4.4 trillion, and Western Union has announced plans to launch a stablecoin on the Solana network to enhance treasury operations.
Bearish momentum persists as conflicting signals generate sideways bias
Momentum remains weak, as the daily MACD signals a strong sell and the ADX reading of 34.97 confirms a dominant negative trend. The daily RSI (41.92) and Commodity Channel Index (–62.63) point to ongoing bearish momentum, though not yet oversold, while the Stochastic RSI is neutral. Bull/Bear Power is deep in oversold territory (–0.98), signaling clear seller dominance intraday. The Awesome Oscillator gives a buy signal, which is mildly supportive, yet this contradicts broader momentum signals. There was no notable gap between the previous close and today’s open, and SOL is currently trading near the middle of today’s range amid moderate volatility. The current intraday tone suggests sideways consolidation despite a modest daily gain of 1.31%, highlighting ongoing divergence between minor rebounds and the dominant trend.
Downside favored amid persistent weekly sell signals and defined ranges
For the next five sessions, SOL is expected to move in a $75.00 – $92.00 range, within a typical volatility band relative to current levels. There is a very low probability (less than 20%) of a sustained rise, with downside more likely, given that all weekly momentum indicators continue to signal sell. The baseline scenario is sideways movement between immediate support and resistance. Should a bullish outcome prevail, SOL could regain strength above $85.00 and move beyond immediate resistance at $84.84, while a bearish scenario would see SOL drop below $80.00 and challenge the lower end of the weekly band in response to continued selling momentum.
Last time, analysts noted that Solana remains under bearish pressure, trading below key moving averages with continued weakness signaled by momentum indicators such as MACD and RSI. Immediate resistance is seen at the Ichimoku Kijun line, and price action is expected to stay range-bound barring a decisive move above resistance or below support.


Latest Solana News


-
 Afghanistan
-
 Albania
-
 Algeria
-
 Angola
-
 Argentina
-
 Armenia
-
 Australia
-
 Austria
-
 Azerbaijan
-
 Bahamas
-
 Bahrain
-
 Bangladesh
-
 Belarus
-
 Belgium
-
 Bolivia
-
 Botswana
-
 Brazil
-
 Brunei
-
 Bulgaria
-
 Cambodia
-
 Cameroon
-
 Canada
-
 Chile
Chile
-
 China
China
-
 Colombia
-
 Congo
Congo
-
 Costa Rica
-
 Cote d'Ivoire
-
 Croatia
-
 Cuba
Cuba
-
 Cyprus
-
 Czechia
-
 DR Congo
-
 Denmark
-
 Dominican Republic
-
 Ecuador
-
 Egypt
Egypt
-
 El Salvador
-
 Estonia
-
 Eswatini
-
 Ethiopia
-
 Finland
-
 France
-
 Georgia
-
 Germany
-
 Ghana
Ghana
-
 Greece
-
 Haiti
Haiti
-
 Hong Kong
-
 Hungary
-
 India
India
-
 Indonesia
-
 Iran, Islamic republic
-
 Iraq
Iraq
-
 Ireland
-
 Israel
-
 Italy
Italy
-
 Jamaica
-
 Japan
Japan
-
 Jordan
-
 Kazakhstan
-
 Kenya
Kenya
-
 Korea
Korea
-
 Kuwait
-
 Kyrgyzstan
-
 Laos
Laos
-
 Latvia
-
 Lebanon
-
 Lesotho
-
 Libya
Libya
-
 Lithuania
-
 Luxembourg
-
 Madagascar
-
 Malaysia
-
 Malta
Malta
-
 Mauritius
-
 Mexico
-
 Moldova
-
 Mongolia
-
 Montenegro
-
 Morocco
-
 Mozambique
-
 Myanmar
-
 Namibia
-
 Nepal
Nepal
-
 Netherlands
-
 New Zealand
-
 Nigeria
-
 North Macedonia
-
 Norway
-
 Oman
Oman
-
 Pakistan
-
 Palestine
-
 Panama
-
 Papua New Guinea
-
 Paraguay
-
 Peru
Peru
-
 Philippines
-
 Poland
-
 Portugal
-
 Puerto Rico
-
 Qatar
Qatar
-
 Reunion
-
 Romania
-
 Rwanda
-
 Saudi Arabia
-
 Serbia
-
 Singapore
-
 Slovakia
-
 Slovenia
-
 Somalia
-
 South Africa
-
 Spain
Spain
-
 Sri Lanka
-
 Sweden
-
 Switzerland
-
 Syria
Syria
-
 Taiwan
-
 Tajikistan
-
 Tanzania
-
 Thailand
-
 Trinidad and Tobago
-
 Tunisia
-
 Turkey
-
 UAE
UAE
-
 Uganda
-
 Ukraine
-
 United Kingdom
-
United States
-
 Uruguay
-
 Uzbekistan
-
 Venezuela
-
 Vietnam
-
 Yemen
Yemen
-
 Zambia
-
 Zimbabwe
- Forex
- Crypto
