
Institutional ETF inflows fail to halt selling — Polkadot slumps 7.06%

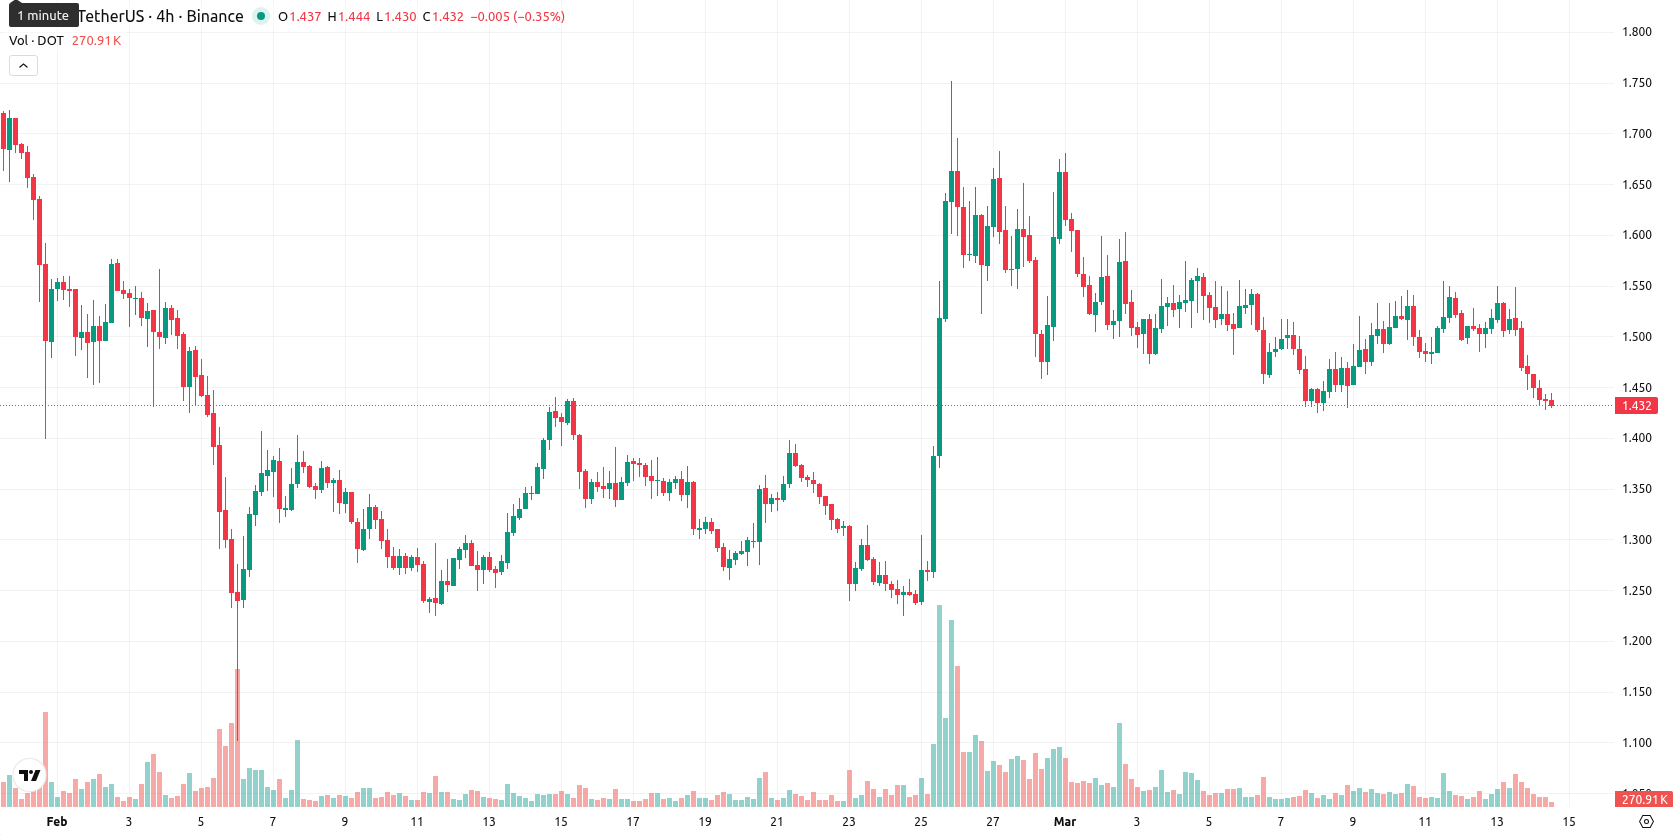
Polkadot (DOT) is trading below all major moving averages: its current price of $1.434 sits under the MA-20 ($1.493), MA-50 ($1.495), and MA-200 ($2.562), signaling persistent seller control across short-, medium-, and long-term trends. The D1 Ichimoku Kijun is at $1.489, which is above the current price and therefore acts as immediate resistance.
Highlights
- 21Shares debuted the first spot Polkadot ETF (TDOT) on NASDAQ, offering direct DOT exposure with a 0.30% fee.
- Institutional investors committed $544,480 at launch, but DOT's price stayed under broad selling pressure despite increased futures open interest.
- DOT trades below major support levels, with technical indicators broadly bearish and next week's price likely confined to a $1.36–$1.61 range.
ETF debut and institutional inflows fail to lift price under selling pressure
On March 6, 2026, 21Shares launched the first spot Polkadot ETF, TDOT, on NASDAQ, offering physical backing and direct exposure to the DOT token. TDOT charges a 0.30% management fee and does not grant governance rights to ETF holders. Early institutional inflows were recorded, with an initial net entry of $544,480, and Polkadot's futures open interest rose to $256.76 million before stabilizing near $207.60 million by the following Friday, though price action has remained under broader selling pressure.
Technical indicator divergence as high volatility fuels short-term uncertainty
Momentum readings show mixed signals: D1 MACD points to a strong buy, while ADX is neutral, suggesting indecisive trend strength. Oscillators indicate oversold or negative momentum, with D1 RSI at 47.5 (sell), Stoch RSI at 4.7 (oversold), and CCI near neutral. BBP on D1 suggests buyers may be trying to stabilize the decline, despite seller dominance on shorter timeframes. The daily change is sharply negative, with DOT down 7.06% since the previous session. No significant gap occurred at the open, but price now trades near the day’s low in a narrow range, indicating high intraday volatility and ongoing pressure after the open. Divergences between the strong buy MACD and the broadly bearish tone of the other indicators highlight uncertainty in short-term direction.
Limited upside potential as bearish bias dominates expected trading range
Over the next five trading days, the expected range for DOT is $1.360 to $1.610, based on typical volatility and current levels. The probability of price increase is very low (less than 20%), making further declines more likely. Baseline scenario: DOT holds in a sideways corridor between $1.36 and $1.61. Bullish scenario: a break above immediate resistance ($1.489/Kijun) could open room toward the high end of the band, while a bearish scenario would see continued selling pressure potentially pushing DOT below $1.36, with little support evident until lower levels. Indicators on both daily and weekly timeframes skew bearish, so recovery attempts are likely to face strong headwinds.
Earlier, analysts noted that Polkadot was experiencing persistent bearish momentum with technical signals and sentiment both pointing to ongoing seller dominance. With the latest data confirming continued headwinds across multiple timeframes, traders should monitor the $1.36 support level as a potential trigger for renewed downside if selling persists.


Latest Polkadot News


-
 Afghanistan
-
 Albania
-
 Algeria
-
 Angola
-
 Argentina
-
 Armenia
-
 Australia
-
 Austria
-
 Azerbaijan
-
 Bahamas
-
 Bahrain
-
 Bangladesh
-
 Belarus
-
 Belgium
-
 Bolivia
-
 Botswana
-
 Brazil
-
 Brunei
-
 Bulgaria
-
 Cambodia
-
 Cameroon
-
 Canada
-
 Chile
Chile
-
 China
China
-
 Colombia
-
 Congo
Congo
-
 Costa Rica
-
 Cote d'Ivoire
-
 Croatia
-
 Cuba
Cuba
-
 Cyprus
-
 Czechia
-
 DR Congo
-
 Denmark
-
 Dominican Republic
-
 Ecuador
-
 Egypt
Egypt
-
 El Salvador
-
 Estonia
-
 Eswatini
-
 Ethiopia
-
 Finland
-
 France
-
 Georgia
-
 Germany
-
 Ghana
Ghana
-
 Greece
-
 Haiti
Haiti
-
 Hong Kong
-
 Hungary
-
 India
India
-
 Indonesia
-
 Iran, Islamic republic
-
 Iraq
Iraq
-
 Ireland
-
 Israel
-
 Italy
Italy
-
 Jamaica
-
 Japan
Japan
-
 Jordan
-
 Kazakhstan
-
 Kenya
Kenya
-
 Korea
Korea
-
 Kuwait
-
 Kyrgyzstan
-
 Laos
Laos
-
 Latvia
-
 Lebanon
-
 Lesotho
-
 Libya
Libya
-
 Lithuania
-
 Luxembourg
-
 Madagascar
-
 Malaysia
-
 Malta
Malta
-
 Mauritius
-
 Mexico
-
 Moldova
-
 Mongolia
-
 Montenegro
-
 Morocco
-
 Mozambique
-
 Myanmar
-
 Namibia
-
 Nepal
Nepal
-
 Netherlands
-
 New Zealand
-
 Nigeria
-
 North Macedonia
-
 Norway
-
 Oman
Oman
-
 Pakistan
-
 Palestine
-
 Panama
-
 Papua New Guinea
-
 Paraguay
-
 Peru
Peru
-
 Philippines
-
 Poland
-
 Portugal
-
 Puerto Rico
-
 Qatar
Qatar
-
 Reunion
-
 Romania
-
 Rwanda
-
 Saudi Arabia
-
 Serbia
-
 Singapore
-
 Slovakia
-
 Slovenia
-
 Somalia
-
 South Africa
-
 Spain
Spain
-
 Sri Lanka
-
 Sweden
-
 Switzerland
-
 Syria
Syria
-
 Taiwan
-
 Tajikistan
-
 Tanzania
-
 Thailand
-
 Trinidad and Tobago
-
 Tunisia
-
 Turkey
-
 UAE
UAE
-
 Uganda
-
 Ukraine
-
 United Kingdom
-
United States
-
 Uruguay
-
 Uzbekistan
-
 Venezuela
-
 Vietnam
-
 Yemen
Yemen
-
 Zambia
-
 Zimbabwe
- Forex
- Crypto
