
Polkadot falls 5.74% with RSI signaling ongoing weakness – weekly forecast

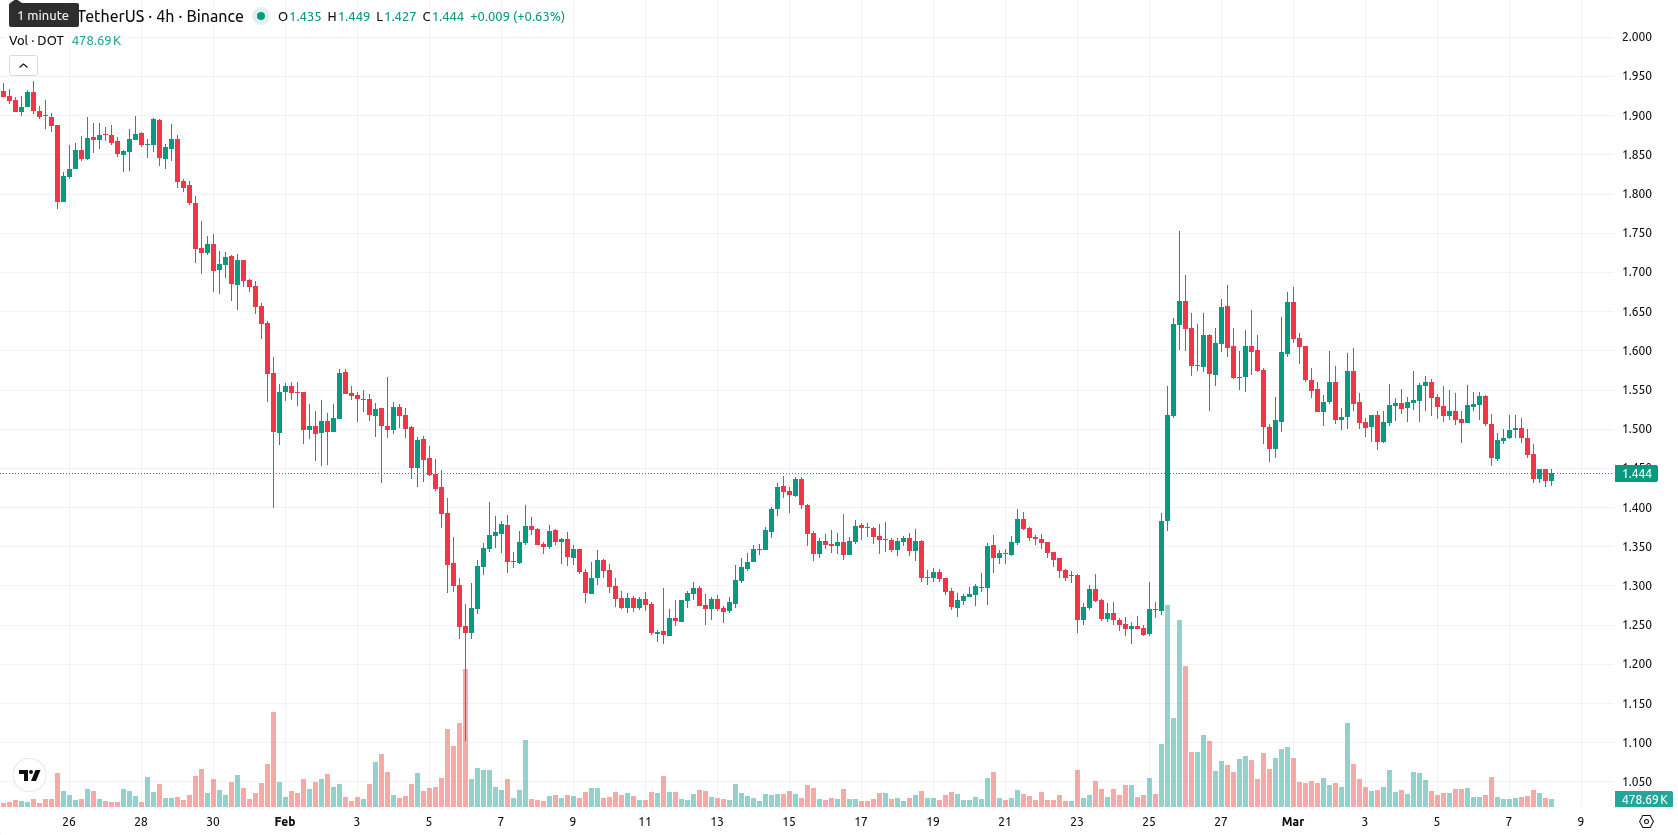
Polkadot (DOT) is currently trading at $1.447, experiencing a decline of 5.74% over the last week. The asset remains well below its weekly MA-20 at $2.047, MA-50 at $3.197, and MA-200 at $5.471, indicating strong ongoing pressure from sellers and underscoring its position at the lower end of the weekly range.
Highlights
- Polkadot trades well below major moving averages, signaling sustained bearish momentum and technical weakness across all timeframes.
- Momentum indicators collectively show persistent downside pressure, with sellers dominating and no significant signs of reversal emerging.
- DOT is expected to consolidate between $1.30 and $1.60 in the coming week, with downside risk outweighing rebound potential.
ETF debut and protocol upgrade drive mixed sentiment for DOT this week
21Shares launched the first spot Polkadot ETF in the United States, trading on Nasdaq under the ticker TDOT with $11 million in seed capital. The ETF is physically backed, offering U.S. investors regulated exposure to DOT through standard brokerage accounts. Additionally, Polkadot will implement a major economic upgrade on March 12, introducing a capped supply, reducing emissions, and changing staking features.
Persistent bearish signals as DOT remains below key weekly averages
Weekly technical analysis for DOT continues to highlight pronounced bearish momentum, with the price staying well beneath all key weekly moving averages (MA-20, MA-50, MA-200). Support is observed at $1.30 and resistance at $1.60 on the W1 chart, while oscillators such as the RSI (32.97) and CCI (–85.22) reflect ongoing weakness that is not yet technically oversold. The MACD and ADX both signal persistent downside, and sellers remain in control according to Bull/Bear Power. Volatility for the week measured 12.02%, and all indicators collectively point to a lack of bullish conviction.
Limited upside expected as technicals point to ongoing consolidation
In the next 5–7 trading days, DOT is expected to consolidate within a range of $1.30 to $1.60, reflecting persistent negative momentum on the weekly chart. The probability of a significant upside move remains low, with technicals offering little indication of a reversal. A bullish turn would require a breakout above $1.60, but a close below $1.30 could open further downside, as all key weekly momentum indicators remain bearish and show no signs of improvement.
Previously it was reported that Polkadot is exhibiting short-term bullish momentum above its near-term moving averages, supported by strong intraday buyer activity, but remains constrained by medium- and long-term resistance levels as broader trends stay bearish. Oscillator signals are mixed with overbought readings and neutral momentum, suggesting limited upside potential and a higher likelihood of consolidation or downside within the current price corridor.


Latest Polkadot News


-
 Afghanistan
-
 Albania
-
 Algeria
-
 Angola
-
 Argentina
-
 Armenia
-
 Australia
-
 Austria
-
 Azerbaijan
-
 Bahamas
-
 Bahrain
-
 Bangladesh
-
 Belarus
-
 Belgium
-
 Bolivia
-
 Botswana
-
 Brazil
-
 Brunei
-
 Bulgaria
-
 Cambodia
-
 Cameroon
-
 Canada
-
 Chile
Chile
-
 China
China
-
 Colombia
-
 Congo
Congo
-
 Costa Rica
-
 Cote d'Ivoire
-
 Croatia
-
 Cuba
Cuba
-
 Cyprus
-
 Czechia
-
 DR Congo
-
 Denmark
-
 Dominican Republic
-
 Ecuador
-
 Egypt
Egypt
-
 El Salvador
-
 Estonia
-
 Eswatini
-
 Ethiopia
-
 Finland
-
 France
-
 Georgia
-
 Germany
-
 Ghana
Ghana
-
 Greece
-
 Haiti
Haiti
-
 Hong Kong
-
 Hungary
-
 India
India
-
 Indonesia
-
 Iran, Islamic republic
-
 Iraq
Iraq
-
 Ireland
-
 Israel
-
 Italy
Italy
-
 Jamaica
-
 Japan
Japan
-
 Jordan
-
 Kazakhstan
-
 Kenya
Kenya
-
 Korea
Korea
-
 Kuwait
-
 Kyrgyzstan
-
 Laos
Laos
-
 Latvia
-
 Lebanon
-
 Lesotho
-
 Libya
Libya
-
 Lithuania
-
 Luxembourg
-
 Madagascar
-
 Malaysia
-
 Malta
Malta
-
 Mauritius
-
 Mexico
-
 Moldova
-
 Mongolia
-
 Montenegro
-
 Morocco
-
 Mozambique
-
 Myanmar
-
 Namibia
-
 Nepal
Nepal
-
 Netherlands
-
 New Zealand
-
 Nigeria
-
 North Macedonia
-
 Norway
-
 Oman
Oman
-
 Pakistan
-
 Palestine
-
 Panama
-
 Papua New Guinea
-
 Paraguay
-
 Peru
Peru
-
 Philippines
-
 Poland
-
 Portugal
-
 Puerto Rico
-
 Qatar
Qatar
-
 Reunion
-
 Romania
-
 Rwanda
-
 Saudi Arabia
-
 Serbia
-
 Singapore
-
 Slovakia
-
 Slovenia
-
 Somalia
-
 South Africa
-
 Spain
Spain
-
 Sri Lanka
-
 Sweden
-
 Switzerland
-
 Syria
Syria
-
 Taiwan
-
 Tajikistan
-
 Tanzania
-
 Thailand
-
 Trinidad and Tobago
-
 Tunisia
-
 Turkey
-
 UAE
UAE
-
 Uganda
-
 Ukraine
-
 United Kingdom
-
United States
-
 Uruguay
-
 Uzbekistan
-
 Venezuela
-
 Vietnam
-
 Yemen
Yemen
-
 Zambia
-
 Zimbabwe
- Forex
- Crypto
