
Polkadot: Scheduled halving and ETF hopes drive price up 7.26% despite longer-term weakness

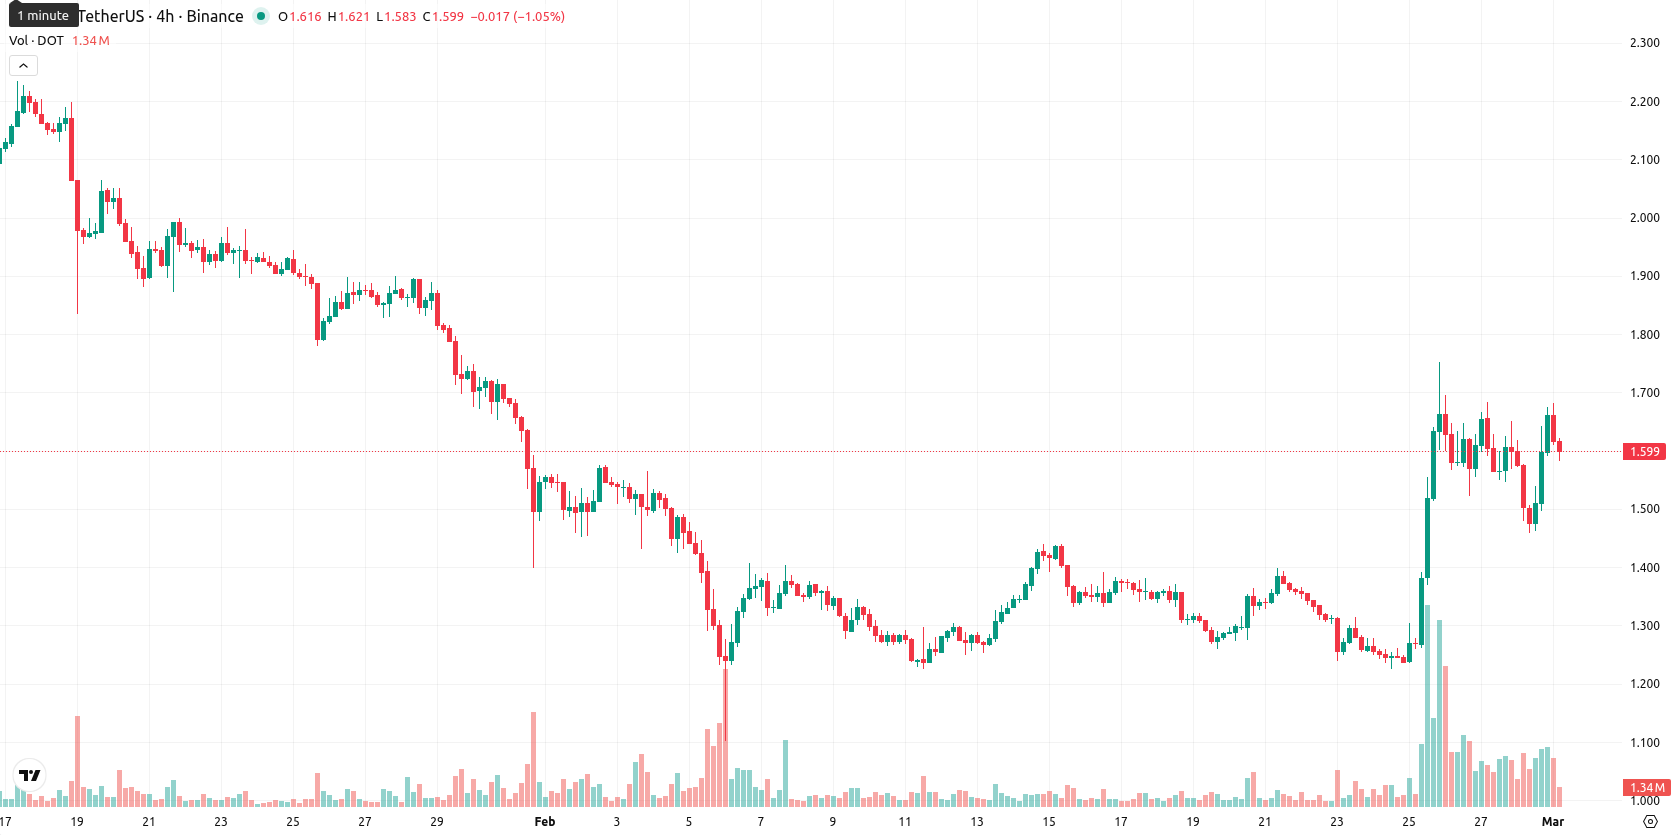
Polkadot (DOT) is trading at $1.596, which is above both the MA-20 ($1.381) and the immediate support from the Ichimoku Kijun ($1.426), but remains below the MA-50 ($1.644) and far beneath the MA-200 ($2.723), reflecting short-term bullish momentum within a longer-term bearish structure. There is no golden or death cross active, and current levels suggest further resistance at the MA-50, with medium- and long-term trends still under bearish pressure.
Highlights
- Polkadot announced a halving event for March 14, 2026, which will cut annual DOT issuance by over 50% and shift toward deflation.
- Rising institutional attention, with speculation about Polkadot ETF filings by Grayscale and 21Shares, is driving heightened trading volume and market activity.
- DOT is trading at $1.596, above MA-20 ($1.381) and Ichimoku Kijun ($1.426), but faces resistance at MA-50 ($1.644) and overall bearish weekly trends.
Halving event speculation and ETF interest fuel trading surge
Polkadot is seeing heightened activity following the announcement of a scheduled halving event set for March 14, 2026, which will reduce the annual issuance of new DOT tokens by over 50% and move the token toward a deflationary supply model. Additional momentum has come from growing institutional interest, as market speculation mounts regarding potential Polkadot ETF filings by firms such as Grayscale and 21Shares. Increased trading volume and sustained attention have further contributed to the current uptick in market activity.
Mixed oscillator signals as intraday volatility highlights buyer strength
Momentum signals are mixed: the MACD is neutral but the ADX shows strong trend strength while RSI remains supportive at 59.85, indicating underlying buying interest. However, both the Stochastic RSI (94.57) and CCI (164.65) suggest overbought conditions, pointing to potential near-term exhaustion. Bull/Bear Power shows clear buyer dominance intraday, which aligns with the Awesome Oscillator’s strong buy signal. There was a clear gap up at the open, with the current price sitting mid-range between today’s high ($1.681) and low ($1.584), reflecting high intraday volatility and underlying strength toward session highs, though this is partially at odds with several oscillators flashing caution.
Downside risk prevails as upside odds remain low
For the next five trading days, the typical volatility band for DOT is expected between $1.40 and $1.75, with the current price at $1.596. The probability of further upside is very low (less than 20%), making further declines more likely as weekly indicators and moving averages on the W1 timeframe remain strongly in sell mode. The base scenario is further consolidation within this projected corridor, while a bullish scenario would require a decisive close above $1.75. Renewed downside risk is confirmed if DOT breaks below the $1.40 area.
Previously it was reported that Polkadot is trading above its short-term moving average and just below the medium-term average, reflecting short- and medium-term bullish momentum while remaining capped by long-term resistance. Despite positive weekly sentiment supported by halving anticipation and ETF speculation, overbought conditions, a neutral MACD, and key resistance near $1.75 suggest a range-bound outlook with limited upside for the coming week.


Latest Polkadot News


-
 Afghanistan
-
 Albania
-
 Algeria
-
 Angola
-
 Argentina
-
 Armenia
-
 Australia
-
 Austria
-
 Azerbaijan
-
 Bahamas
-
 Bahrain
-
 Bangladesh
-
 Belarus
-
 Belgium
-
 Bolivia
-
 Botswana
-
 Brazil
-
 Brunei
-
 Bulgaria
-
 Cambodia
-
 Cameroon
-
 Canada
-
 Chile
Chile
-
 China
China
-
 Colombia
-
 Congo
Congo
-
 Costa Rica
-
 Cote d'Ivoire
-
 Croatia
-
 Cuba
Cuba
-
 Cyprus
-
 Czechia
-
 DR Congo
-
 Denmark
-
 Dominican Republic
-
 Ecuador
-
 Egypt
Egypt
-
 El Salvador
-
 Estonia
-
 Eswatini
-
 Ethiopia
-
 Finland
-
 France
-
 Georgia
-
 Germany
-
 Ghana
Ghana
-
 Greece
-
 Haiti
Haiti
-
 Hong Kong
-
 Hungary
-
 India
India
-
 Indonesia
-
 Iran, Islamic republic
-
 Iraq
Iraq
-
 Ireland
-
 Israel
-
 Italy
Italy
-
 Jamaica
-
 Japan
Japan
-
 Jordan
-
 Kazakhstan
-
 Kenya
Kenya
-
 Korea
Korea
-
 Kuwait
-
 Kyrgyzstan
-
 Laos
Laos
-
 Latvia
-
 Lebanon
-
 Lesotho
-
 Libya
Libya
-
 Lithuania
-
 Luxembourg
-
 Madagascar
-
 Malaysia
-
 Malta
Malta
-
 Mauritius
-
 Mexico
-
 Moldova
-
 Mongolia
-
 Montenegro
-
 Morocco
-
 Mozambique
-
 Myanmar
-
 Namibia
-
 Nepal
Nepal
-
 Netherlands
-
 New Zealand
-
 Nigeria
-
 North Macedonia
-
 Norway
-
 Oman
Oman
-
 Pakistan
-
 Palestine
-
 Panama
-
 Papua New Guinea
-
 Paraguay
-
 Peru
Peru
-
 Philippines
-
 Poland
-
 Portugal
-
 Puerto Rico
-
 Qatar
Qatar
-
 Reunion
-
 Romania
-
 Rwanda
-
 Saudi Arabia
-
 Serbia
-
 Singapore
-
 Slovakia
-
 Slovenia
-
 Somalia
-
 South Africa
-
 Spain
Spain
-
 Sri Lanka
-
 Sweden
-
 Switzerland
-
 Syria
Syria
-
 Taiwan
-
 Tajikistan
-
 Tanzania
-
 Thailand
-
 Trinidad and Tobago
-
 Tunisia
-
 Turkey
-
 UAE
UAE
-
 Uganda
-
 Ukraine
-
 United Kingdom
-
United States
-
 Uruguay
-
 Uzbekistan
-
 Venezuela
-
 Vietnam
-
 Yemen
Yemen
-
 Zambia
-
 Zimbabwe
- Forex
- Crypto
