
Celestia drops 8.41% as short-term selling accelerates above recent averages

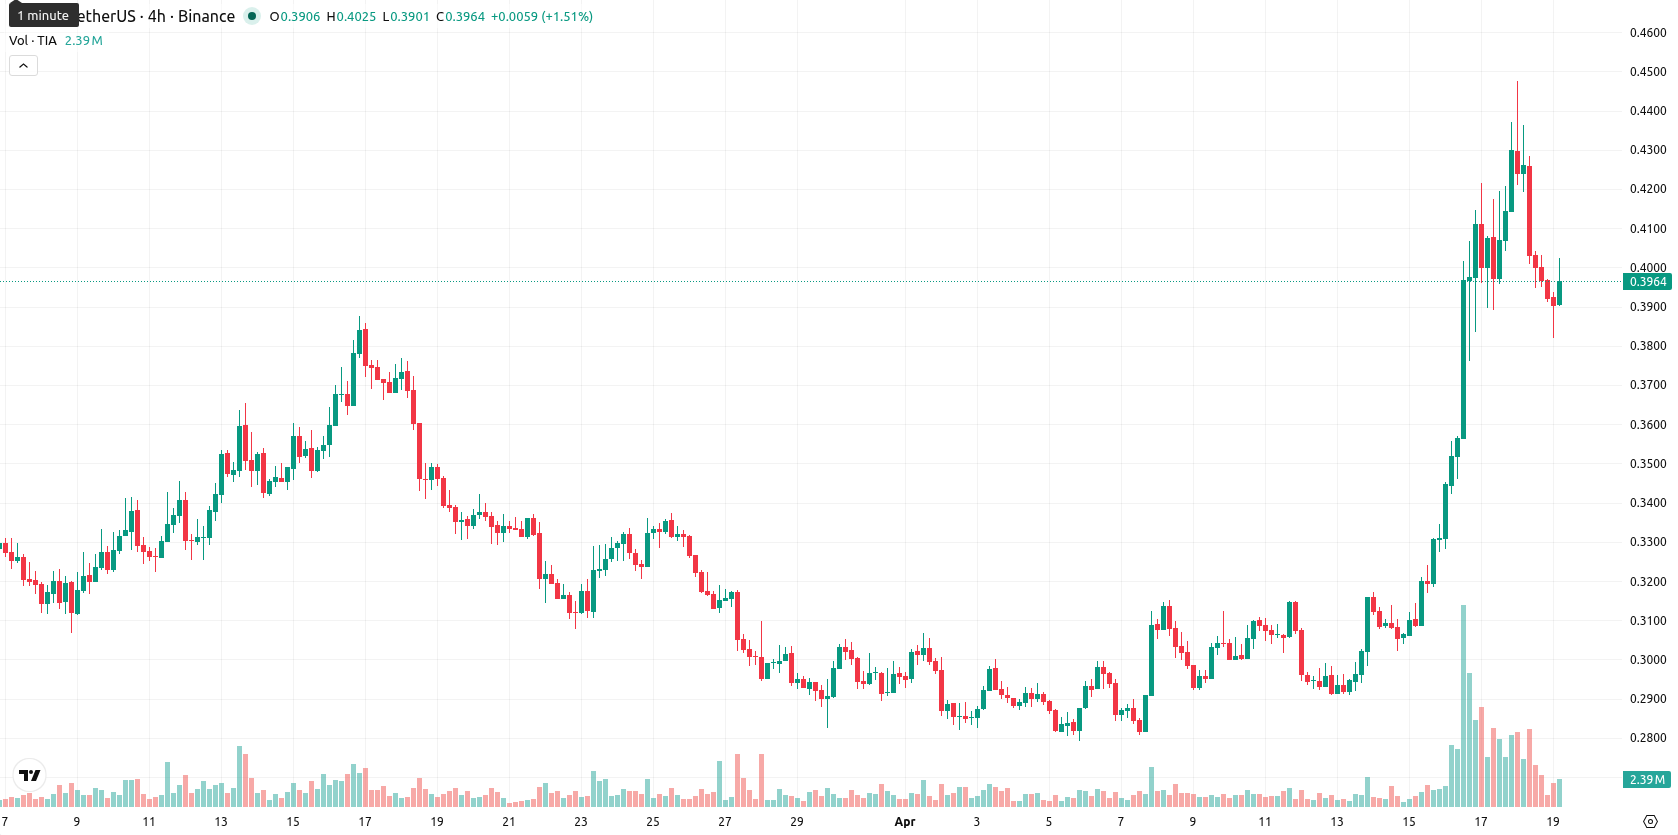
Celestia (TIA) is trading at $0.3963, posting a daily decline of 8.41%. The current price stands above both the SMA-20 ($0.3166) and SMA-50 ($0.3252), while remaining well below the SMA-200 ($0.5857).
Highlights
- TIA shows a short- to medium-term bullish bias but remains under longer-term downside pressure after recent volatility.
- Key technical indicators signal mixed momentum, with bullish MACD and RSI offset by overbought oscillators and weak ADX trend.
- Expected range for the coming week is $0.3910 to $0.4160; probability of a sustained breakout above $0.4160 is under 20%.
Mixed momentum as overbought signals clash with weak trend
This configuration supports a short- to medium-term bullish bias with longer-term downside pressure still present, while the Ichimoku Kijun at $0.3631 sits below the price and acts as immediate support. Momentum signals on the D1 chart show a bullish tilt, with MACD and RSI pointing higher while ADX remains weak at 15, signaling trend indecision. However, Stoch RSI and CCI both flag overbought conditions, suggesting the price is stretched; BBP is mildly positive, indicating buyers still have an edge intraday, and AO also supports the upward trend. The session opened lower without a gap and is trading near the upper end of today’s range, but after slipping 8.41% intraday, volatility has been high and sellers have pressured the market since the open—momentum and oscillators give a mixed, divergent picture.
Downside bias as breakout odds remain low next week
For the coming week, the expected trading range is $0.3910 to $0.4160. There is a very low probability (less than 20%) that TIA will see a sustained move higher, making a downward move more likely. The baseline scenario sees the price consolidating sideways between immediate support and resistance; a bullish scenario would require a break above $0.4160, while a clear move below $0.3910 would indicate a continued bearish trend.
Earlier, analysts noted that Celestia was exhibiting short-term resilience but remained constrained by broader bearish pressures, favoring consolidation amid mixed momentum signals. The latest intraday pullback and diverging technicals reinforce this cautious outlook, making a sustained move above $0.4160 crucial for any immediate bullish reversal.


Latest Celestia News


-
 Afghanistan
-
 Albania
-
 Algeria
-
 Angola
-
 Argentina
-
 Armenia
-
 Australia
-
 Austria
-
 Azerbaijan
-
 Bahamas
-
 Bahrain
-
 Bangladesh
-
 Belarus
-
 Belgium
-
 Bolivia
-
 Botswana
-
 Brazil
-
 Brunei
-
 Bulgaria
-
 Cambodia
-
 Cameroon
-
 Canada
-
 Chile
Chile
-
 China
China
-
 Colombia
-
 Congo
Congo
-
 Costa Rica
-
 Cote d'Ivoire
-
 Croatia
-
 Cuba
Cuba
-
 Cyprus
-
 Czechia
-
 DR Congo
-
 Denmark
-
 Dominican Republic
-
 Ecuador
-
 Egypt
Egypt
-
 El Salvador
-
 Estonia
-
 Eswatini
-
 Ethiopia
-
 Finland
-
 France
-
 Georgia
-
 Germany
-
 Ghana
Ghana
-
 Greece
-
 Haiti
Haiti
-
 Hong Kong
-
 Hungary
-
 India
India
-
 Indonesia
-
 Iran, Islamic republic
-
 Iraq
Iraq
-
 Ireland
-
 Israel
-
 Italy
Italy
-
 Jamaica
-
 Japan
Japan
-
 Jordan
-
 Kazakhstan
-
 Kenya
Kenya
-
 Korea
Korea
-
 Kuwait
-
 Kyrgyzstan
-
 Laos
Laos
-
 Latvia
-
 Lebanon
-
 Lesotho
-
 Libya
Libya
-
 Lithuania
-
 Luxembourg
-
 Madagascar
-
 Malaysia
-
 Malta
Malta
-
 Mauritius
-
 Mexico
-
 Moldova
-
 Mongolia
-
 Montenegro
-
 Morocco
-
 Mozambique
-
 Myanmar
-
 Namibia
-
 Nepal
Nepal
-
 Netherlands
-
 New Zealand
-
 Nigeria
-
 North Macedonia
-
 Norway
-
 Oman
Oman
-
 Pakistan
-
 Palestine
-
 Panama
-
 Papua New Guinea
-
 Paraguay
-
 Peru
Peru
-
 Philippines
-
 Poland
-
 Portugal
-
 Puerto Rico
-
 Qatar
Qatar
-
 Reunion
-
 Romania
-
 Rwanda
-
 Saudi Arabia
-
 Serbia
-
 Singapore
-
 Slovakia
-
 Slovenia
-
 Somalia
-
 South Africa
-
 Spain
Spain
-
 Sri Lanka
-
 Sweden
-
 Switzerland
-
 Syria
Syria
-
 Taiwan
-
 Tajikistan
-
 Tanzania
-
 Thailand
-
 Trinidad and Tobago
-
 Tunisia
-
 Turkey
-
 UAE
UAE
-
 Uganda
-
 Ukraine
-
 United Kingdom
-
United States
-
 Uruguay
-
 Uzbekistan
-
 Venezuela
-
 Vietnam
-
 Yemen
Yemen
-
 Zambia
-
 Zimbabwe
- Forex
- Crypto
