
Hut 8 stock: Volatility and overbought signals trigger a 3.55% drop

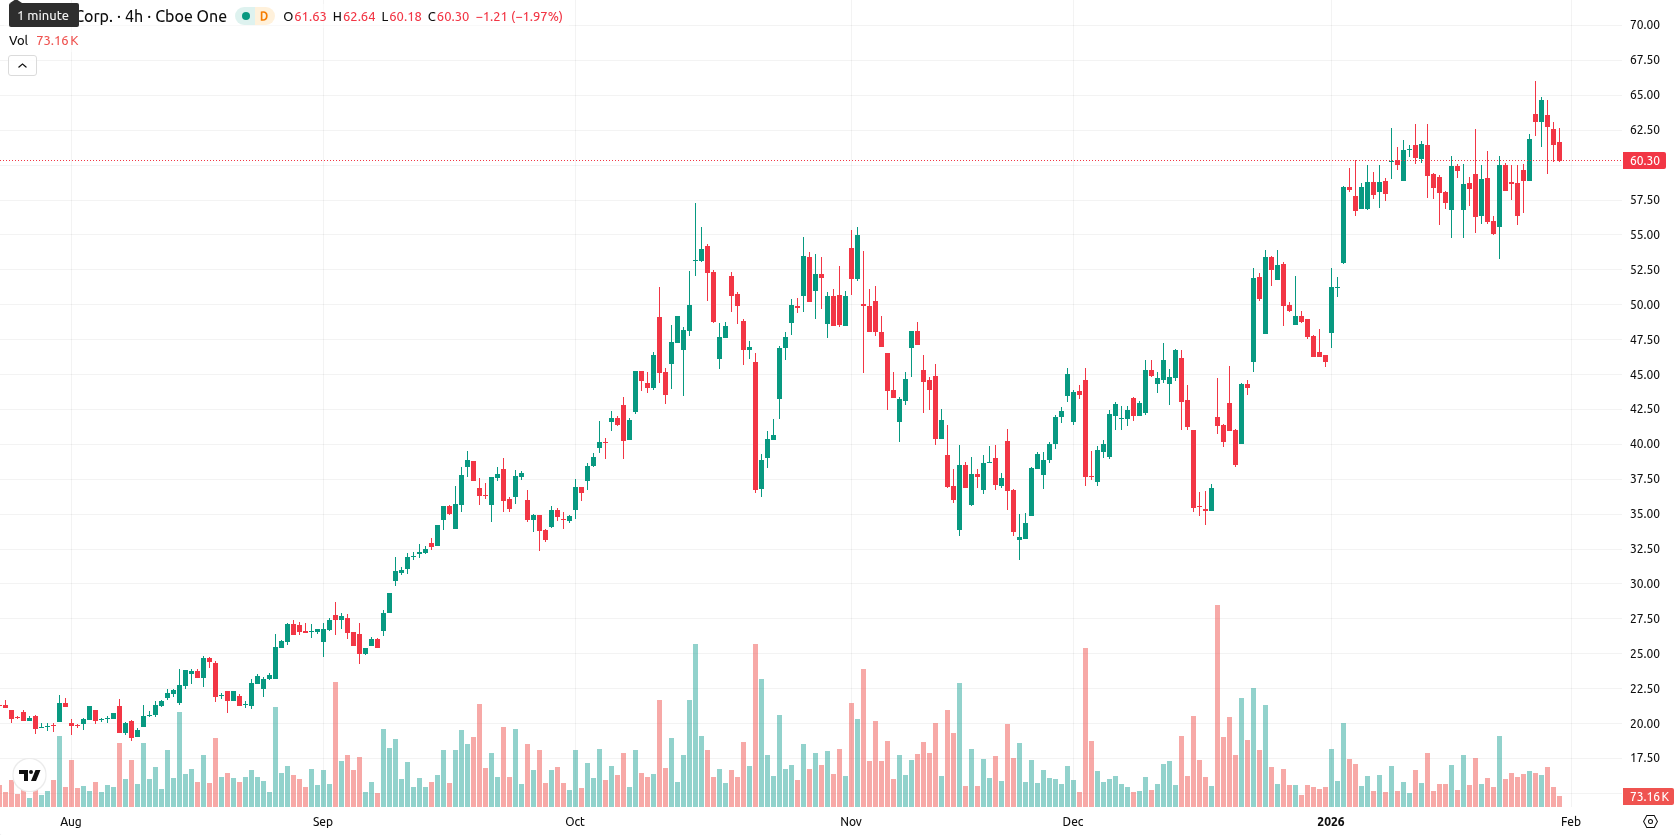
Hut 8 Corp (HUT) is trading at $59.35, down 3.55% from the previous close and showing heightened volatility with the last trade near today’s low of $58.93. The asset remains firmly above the MA-20 at $58.12, MA-50 at $48.70, and MA-200 at $31.90, reflecting continued bullish momentum against key technical benchmarks.
Highlights
- Hut 8 reported profitable Q3 2025 results and will release full-year 2025 financials on February 25, 2026, with an investor webcast scheduled.
- The company completed a 310 MW power portfolio sale and signed an AI infrastructure partnership with Anthropic and Fluidstack, advancing its digital infrastructure expansion.
- HUT trades at $59.35, above MA-20 ($58.12), MA-50 ($48.70), and MA-200 ($31.90), with immediate dynamic support near $55.61 and resistance around $60–$61.80.
AI partnerships and asset sale accelerate expansion and investor focus
Hut 8 recently reported profitable Q3 2025 results and has announced the upcoming release of its full-year 2025 financials before market open on February 25, 2026, with an investor webcast to follow. The company completed a 310 MW power portfolio sale and entered into an AI infrastructure partnership with Anthropic and Fluidstack, highlighting its continued expansion into AI and digital infrastructure. Additional initiatives include appointing Jacobs as lead for engineering and management of the River Bend data center.
Overbought signals emerge as price nears resistance amid volatility
With HUT trading above its MA-20, MA-50, and MA-200, bullish momentum is confirmed across short, medium, and long-term perspectives. The price sits above the Ichimoku Kijun at $55.61, providing dynamic support, while the next resistance appears near $60. MACD offers a strong buy signal, and the ADX is neutral, but overbought readings from the Commodity Channel Index as well as Bull/Bear Power suggest buyer pressure is elevated. Stochastic RSI indicates some downside risk, and the drop in price today emphasizes ongoing volatility and seller activity after the open, pointing to a potential near-term consolidation period.
Limited downside risk as volatility defines short-term trading band
Looking toward the next five trading days, HUT is expected to fluctuate within a typical volatility band between $58.50 and $61.80. There is a high probability (over 80%) of additional gains, while downside risk remains limited. The most likely scenario is continued sideways movement between these levels, though a break above $61.80 could prompt further upside, and a move below $58.50 may trigger added profit-taking down toward the Ichimoku Kijun support.
Previously it was reported that Hut 8 Corp remains in a bullish structure, trading above key moving averages across all time frames, despite today's significant drop and heightened intraday volatility. While major trend indicators and MACD remain positive, mixed momentum oscillators and overbought signals suggest a near-term consolidation within the current volatility band, with dynamic support seen near $52.97.


Latest Hut 8 News


-
 Afghanistan
-
 Albania
-
 Algeria
-
 Angola
-
 Argentina
-
 Armenia
-
 Australia
-
 Austria
-
 Azerbaijan
-
 Bahamas
-
 Bahrain
-
 Bangladesh
-
 Belarus
-
 Belgium
-
 Bolivia
-
 Botswana
-
 Brazil
-
 Brunei
-
 Bulgaria
-
 Cambodia
-
 Cameroon
-
 Canada
-
 Chile
Chile
-
 China
China
-
 Colombia
-
 Congo
Congo
-
 Costa Rica
-
 Cote d'Ivoire
-
 Croatia
-
 Cuba
Cuba
-
 Cyprus
-
 Czechia
-
 DR Congo
-
 Denmark
-
 Dominican Republic
-
 Ecuador
-
 Egypt
Egypt
-
 El Salvador
-
 Estonia
-
 Eswatini
-
 Ethiopia
-
 Finland
-
 France
-
 Georgia
-
 Germany
-
 Ghana
Ghana
-
 Greece
-
 Haiti
Haiti
-
 Hong Kong
-
 Hungary
-
 India
India
-
 Indonesia
-
 Iran, Islamic republic
-
 Iraq
Iraq
-
 Ireland
-
 Israel
-
 Italy
Italy
-
 Jamaica
-
 Japan
Japan
-
 Jordan
-
 Kazakhstan
-
 Kenya
Kenya
-
 Korea
Korea
-
 Kuwait
-
 Kyrgyzstan
-
 Laos
Laos
-
 Latvia
-
 Lebanon
-
 Lesotho
-
 Libya
Libya
-
 Lithuania
-
 Luxembourg
-
 Madagascar
-
 Malaysia
-
 Malta
Malta
-
 Mauritius
-
 Mexico
-
 Moldova
-
 Mongolia
-
 Montenegro
-
 Morocco
-
 Mozambique
-
 Myanmar
-
 Namibia
-
 Nepal
Nepal
-
 Netherlands
-
 New Zealand
-
 Nigeria
-
 North Macedonia
-
 Norway
-
 Oman
Oman
-
 Pakistan
-
 Palestine
-
 Panama
-
 Papua New Guinea
-
 Paraguay
-
 Peru
Peru
-
 Philippines
-
 Poland
-
 Portugal
-
 Puerto Rico
-
 Qatar
Qatar
-
 Reunion
-
 Romania
-
 Rwanda
-
 Saudi Arabia
-
 Serbia
-
 Singapore
-
 Slovakia
-
 Slovenia
-
 Somalia
-
 South Africa
-
 Spain
Spain
-
 Sri Lanka
-
 Sweden
-
 Switzerland
-
 Syria
Syria
-
 Taiwan
-
 Tajikistan
-
 Tanzania
-
 Thailand
-
 Trinidad and Tobago
-
 Tunisia
-
 Turkey
-
 UAE
UAE
-
 Uganda
-
 Ukraine
-
 United Kingdom
-
United States
-
 Uruguay
-
 Uzbekistan
-
 Venezuela
-
 Vietnam
-
 Yemen
Yemen
-
 Zambia
-
 Zimbabwe
- Forex
- Crypto
