
-6.33% for Globalstar stock — oversold signals and uncertainty despite long-term support

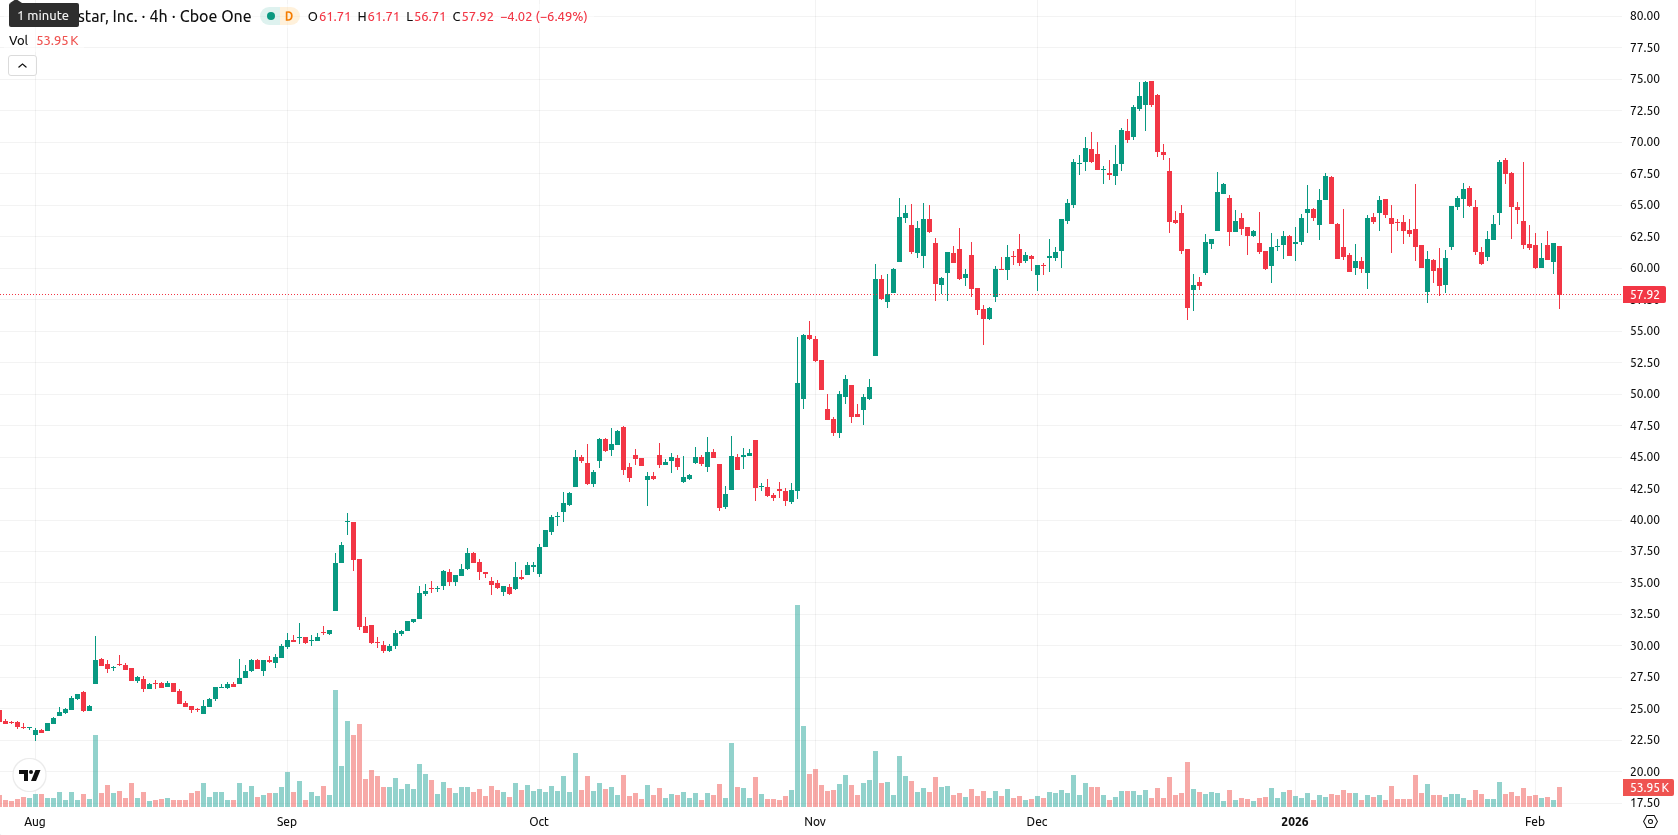
Globalstar, Inc. (GSAT) is trading at $58.06, which is below the MA-20 ($62.71) and MA-50 ($63.29) but remains well above the MA-200 ($38.83), signaling short- and medium-term bearish pressure while the long-term structure stays positive.
Highlights
- Globalstar partnered with Boingo Wireless to deploy its XCOM RAN platform in private 5G networks at venues like airports, stadiums, and military bases.
- The XCOM RAN uses Band 53 to support mission-critical automation, aligning with Boingo's strategy for high-performance, secure network infrastructure in demanding environments.
- GSAT trades at $58.06, below MA-20 ($62.71) and MA-50 ($63.29) but above MA-200 ($38.83); expected price range is $56.00–$61.50 with a high probability of sideways consolidation.
Private 5G collaboration strengthens operational focus for Globalstar
Globalstar has announced a partnership with Boingo Wireless to integrate its XCOM RAN platform into Boingo’s private 5G network deployments, aiming to provide secure and reliable connectivity at high-demand venues such as airports, stadiums, healthcare facilities, and military bases. The XCOM RAN leverages Band 53 and is designed to support mission-critical automation, fitting Boingo's strategy for high-performance network infrastructure. This collaboration highlights ongoing operational developments for Globalstar in telecommunications solutions.
Mixed momentum and diverging oscillators shape uncertain technical outlook
The nearest dynamic resistance for GSAT is at the Ichimoku Kijun ($62.95), while the MA-200 acts as long-term support at a much lower level. Momentum indicators offer mixed signals: the MACD is neutral, ADX indicates a weak trend, RSI leans bearish at 48.82, Stochastic RSI shows a strong buy at a low level, and CCI is slightly negative, collectively suggesting the asset is approaching oversold conditions. Bull/Bear Power at 0.22 reflects oversold momentum and seller dominance intraday, but the Awesome Oscillator points up, partially offsetting immediate weakness. Oscillators are diverging from short-term momentum, contributing to an uncertain technical outlook.
High upside odds as range-bound trade dominates short-term scenario
GSAT is expected to consolidate sideways in the $56.00 to $61.50 volatility band over the next five trading days. The probability of a price increase is very high (above 80%) due to predominantly bullish weekly signals, making a meaningful decline less likely. The baseline scenario sees the asset range-bound within $56.00 to $61.50, while a breakout above $62.95 could trigger a move toward $64.00. A bearish scenario would only emerge if support at $56.00 fails, raising the risk of a correction toward the low $50s.
Last time, analysts noted that Globalstar Inc. (GSAT) is exhibiting persistent short- and medium-term bearish momentum, trading well below its 20- and 50-day moving averages but remaining above its long-term average, with Ichimoku signaling dynamic resistance overhead. Momentum indicators are mixed to negative, with RSI, CCI, and Stochastic RSI confirming oversold conditions and heightened selling pressure, though deeply oversold readings may allow for a short-term technical rebound.


Latest Globalstar News


-
 Afghanistan
-
 Albania
-
 Algeria
-
 Angola
-
 Argentina
-
 Armenia
-
 Australia
-
 Austria
-
 Azerbaijan
-
 Bahamas
-
 Bahrain
-
 Bangladesh
-
 Belarus
-
 Belgium
-
 Bolivia
-
 Botswana
-
 Brazil
-
 Brunei
-
 Bulgaria
-
 Cambodia
-
 Cameroon
-
 Canada
-
 Chile
Chile
-
 China
China
-
 Colombia
-
 Congo
Congo
-
 Costa Rica
-
 Cote d'Ivoire
-
 Croatia
-
 Cuba
Cuba
-
 Cyprus
-
 Czechia
-
 DR Congo
-
 Denmark
-
 Dominican Republic
-
 Ecuador
-
 Egypt
Egypt
-
 El Salvador
-
 Estonia
-
 Eswatini
-
 Ethiopia
-
 Finland
-
 France
-
 Georgia
-
 Germany
-
 Ghana
Ghana
-
 Greece
-
 Haiti
Haiti
-
 Hong Kong
-
 Hungary
-
 India
India
-
 Indonesia
-
 Iran, Islamic republic
-
 Iraq
Iraq
-
 Ireland
-
 Israel
-
 Italy
Italy
-
 Jamaica
-
 Japan
Japan
-
 Jordan
-
 Kazakhstan
-
 Kenya
Kenya
-
 Korea
Korea
-
 Kuwait
-
 Kyrgyzstan
-
 Laos
Laos
-
 Latvia
-
 Lebanon
-
 Lesotho
-
 Libya
Libya
-
 Lithuania
-
 Luxembourg
-
 Madagascar
-
 Malaysia
-
 Malta
Malta
-
 Mauritius
-
 Mexico
-
 Moldova
-
 Mongolia
-
 Montenegro
-
 Morocco
-
 Mozambique
-
 Myanmar
-
 Namibia
-
 Nepal
Nepal
-
 Netherlands
-
 New Zealand
-
 Nigeria
-
 North Macedonia
-
 Norway
-
 Oman
Oman
-
 Pakistan
-
 Palestine
-
 Panama
-
 Papua New Guinea
-
 Paraguay
-
 Peru
Peru
-
 Philippines
-
 Poland
-
 Portugal
-
 Puerto Rico
-
 Qatar
Qatar
-
 Reunion
-
 Romania
-
 Rwanda
-
 Saudi Arabia
-
 Serbia
-
 Singapore
-
 Slovakia
-
 Slovenia
-
 Somalia
-
 South Africa
-
 Spain
Spain
-
 Sri Lanka
-
 Sweden
-
 Switzerland
-
 Syria
Syria
-
 Taiwan
-
 Tajikistan
-
 Tanzania
-
 Thailand
-
 Trinidad and Tobago
-
 Tunisia
-
 Turkey
-
 UAE
UAE
-
 Uganda
-
 Ukraine
-
 United Kingdom
-
United States
-
 Uruguay
-
 Uzbekistan
-
 Venezuela
-
 Vietnam
-
 Yemen
Yemen
-
 Zambia
-
 Zimbabwe
- Forex
- Crypto
