
BlueBird 7 launch plans, technical pressures: AST SpaceMobile stock drops 3.12%

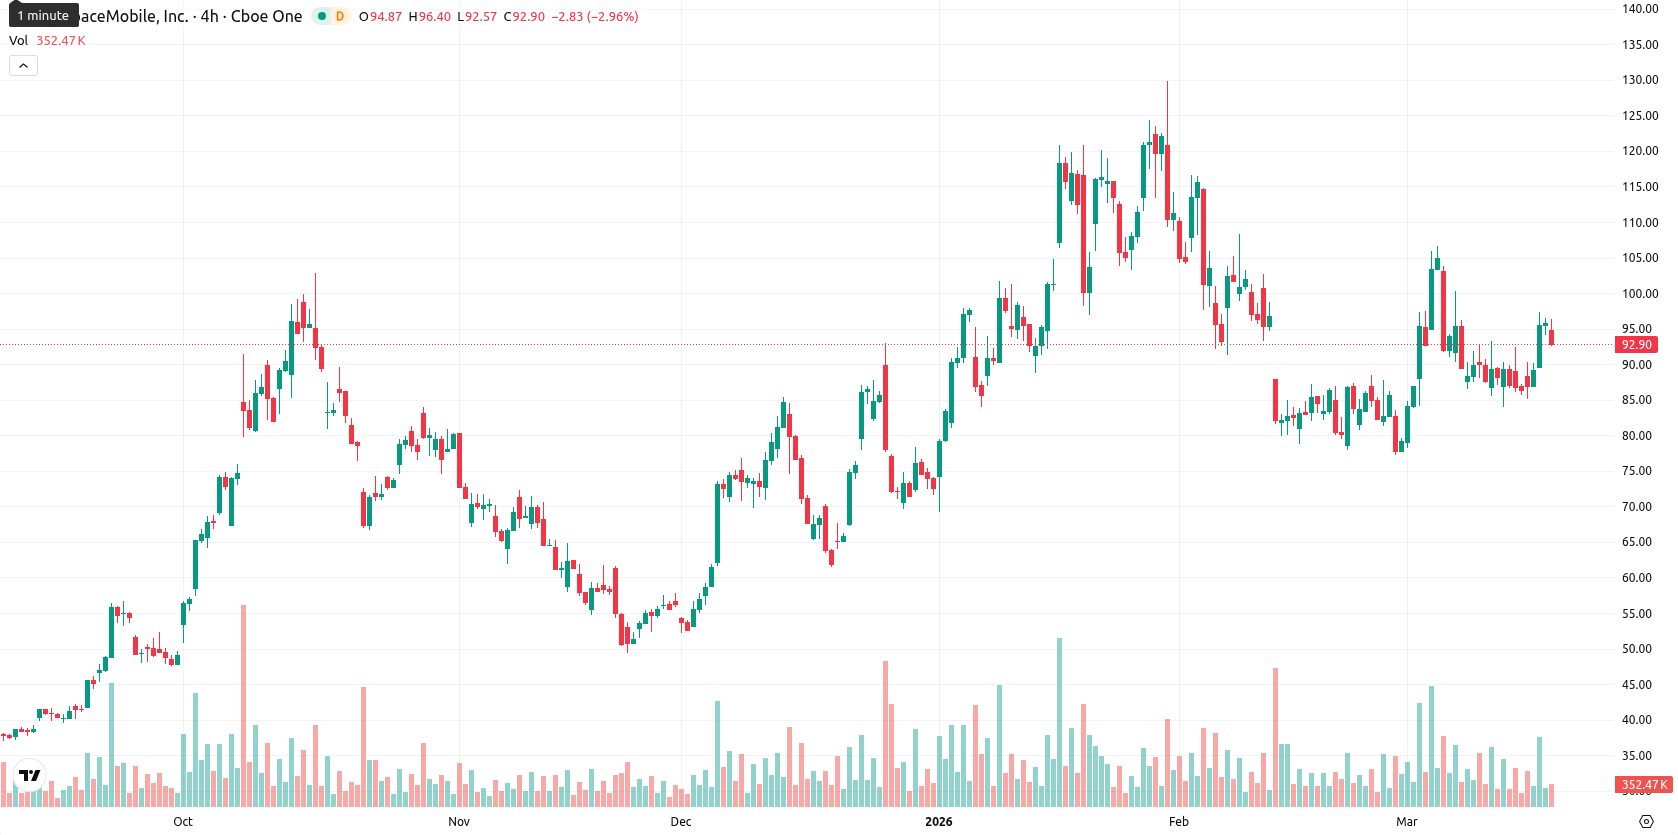
AST SpaceMobile Inc. (ASTS) is trading at $92.71 after falling 3.12% today. The price remains above the SMA-20 ($87.98) but below the SMA-50 ($96.08), and well above the SMA-200 ($66.79), reflecting a bullish short- and long-term trend even as it faces interim resistance around its medium-term moving average.
Highlights
- AST SpaceMobile secured a $30 million U.S. government contract to demonstrate next-generation tactical satellite communications with BlueBird satellites.
- BlueBird 6’s successful deployment and Stance Capital LLC’s Q3 share acquisition support the company’s commercialization outlook despite ongoing selling pressure.
- Technicals show ASTS trading in a bullish consolidation band between $85 and $102, with momentum mixed and buyers recently stalling but longer-term signals favoring upside continuation.
Launch readiness and contracts emerge amid continued selling pressure
AST SpaceMobile announced on March 17, 2026, that its BlueBird 7 satellite is encapsulated and ready for launch, following the successful unfolding of BlueBird 6 as a technical milestone achieved for future commercialization. The company has reported a $30 million contract with the U.S. government to demonstrate tactical satellite communication capabilities, and also noted an acquisition of 34,704 shares during the third quarter by Stance Capital LLC. These developments have emerged though price action has remained under broader selling pressure.
Mixed momentum and overbought signals cap gains near resistance
From a technical perspective, ASTS is above the SMA-20 but still trades below the SMA-50, maintaining a strong stance relative to the SMA-200. The Ichimoku Kijun level at $92.77 marks nearby resistance. Momentum indicators are mixed: the MACD on the D1 chart signals strong selling, ADX is neutral, RSI stands positive at 54.29, CCI is overbought, Stoch RSI is neutral, and BBP also signals overbought. The Awesome Oscillator remains neutral. The stock closed near the lower end of its daily trading range ($92.64–$96.07), with moderate volatility and ongoing pressure following the open.
Upside favored as technicals back consolidation within wide range
In the short term, ASTS is expected to consolidate within a weekly range of $85 to $102, reflecting a typical volatility band relative to current levels. Technical readings suggest a greater than 80% probability of an upward move, as weekly RSI, ADX, MACD, and MA-50 remain on 'Buy' or 'Strong Buy'. The baseline case is continued consolidation inside this band, with a breakout above $93 targeting $102 on the upside. A clear break below $85 could signal a deeper decline, risking a move to retest longer-term supports.
Earlier, analysts noted that despite selling pressure and mixed technical signals, AST SpaceMobile maintained a generally bullish long-term outlook supported by its ongoing commercial and government milestones. This view is further reinforced by recent developments and resilient momentum, making the $93 threshold a crucial pivot for gauging near-term strength as the stock tests resistance after technical and contract-related advances.


Latest AST SpaceMobile News


-
 Afghanistan
-
 Albania
-
 Algeria
-
 Angola
-
 Argentina
-
 Armenia
-
 Australia
-
 Austria
-
 Azerbaijan
-
 Bahamas
-
 Bahrain
-
 Bangladesh
-
 Belarus
-
 Belgium
-
 Bolivia
-
 Botswana
-
 Brazil
-
 Brunei
-
 Bulgaria
-
 Cambodia
-
 Cameroon
-
 Canada
-
 Chile
Chile
-
 China
China
-
 Colombia
-
 Congo
Congo
-
 Costa Rica
-
 Cote d'Ivoire
-
 Croatia
-
 Cuba
Cuba
-
 Cyprus
-
 Czechia
-
 DR Congo
-
 Denmark
-
 Dominican Republic
-
 Ecuador
-
 Egypt
Egypt
-
 El Salvador
-
 Estonia
-
 Eswatini
-
 Ethiopia
-
 Finland
-
 France
-
 Georgia
-
 Germany
-
 Ghana
Ghana
-
 Greece
-
 Haiti
Haiti
-
 Hong Kong
-
 Hungary
-
 India
India
-
 Indonesia
-
 Iran, Islamic republic
-
 Iraq
Iraq
-
 Ireland
-
 Israel
-
 Italy
Italy
-
 Jamaica
-
 Japan
Japan
-
 Jordan
-
 Kazakhstan
-
 Kenya
Kenya
-
 Korea
Korea
-
 Kuwait
-
 Kyrgyzstan
-
 Laos
Laos
-
 Latvia
-
 Lebanon
-
 Lesotho
-
 Libya
Libya
-
 Lithuania
-
 Luxembourg
-
 Madagascar
-
 Malaysia
-
 Malta
Malta
-
 Mauritius
-
 Mexico
-
 Moldova
-
 Mongolia
-
 Montenegro
-
 Morocco
-
 Mozambique
-
 Myanmar
-
 Namibia
-
 Nepal
Nepal
-
 Netherlands
-
 New Zealand
-
 Nigeria
-
 North Macedonia
-
 Norway
-
 Oman
Oman
-
 Pakistan
-
 Palestine
-
 Panama
-
 Papua New Guinea
-
 Paraguay
-
 Peru
Peru
-
 Philippines
-
 Poland
-
 Portugal
-
 Puerto Rico
-
 Qatar
Qatar
-
 Reunion
-
 Romania
-
 Rwanda
-
 Saudi Arabia
-
 Serbia
-
 Singapore
-
 Slovakia
-
 Slovenia
-
 Somalia
-
 South Africa
-
 Spain
Spain
-
 Sri Lanka
-
 Sweden
-
 Switzerland
-
 Syria
Syria
-
 Taiwan
-
 Tajikistan
-
 Tanzania
-
 Thailand
-
 Trinidad and Tobago
-
 Tunisia
-
 Turkey
-
 UAE
UAE
-
 Uganda
-
 Ukraine
-
 United Kingdom
-
United States
-
 Uruguay
-
 Uzbekistan
-
 Venezuela
-
 Vietnam
-
 Yemen
Yemen
-
 Zambia
-
 Zimbabwe
- Forex
- Crypto
