
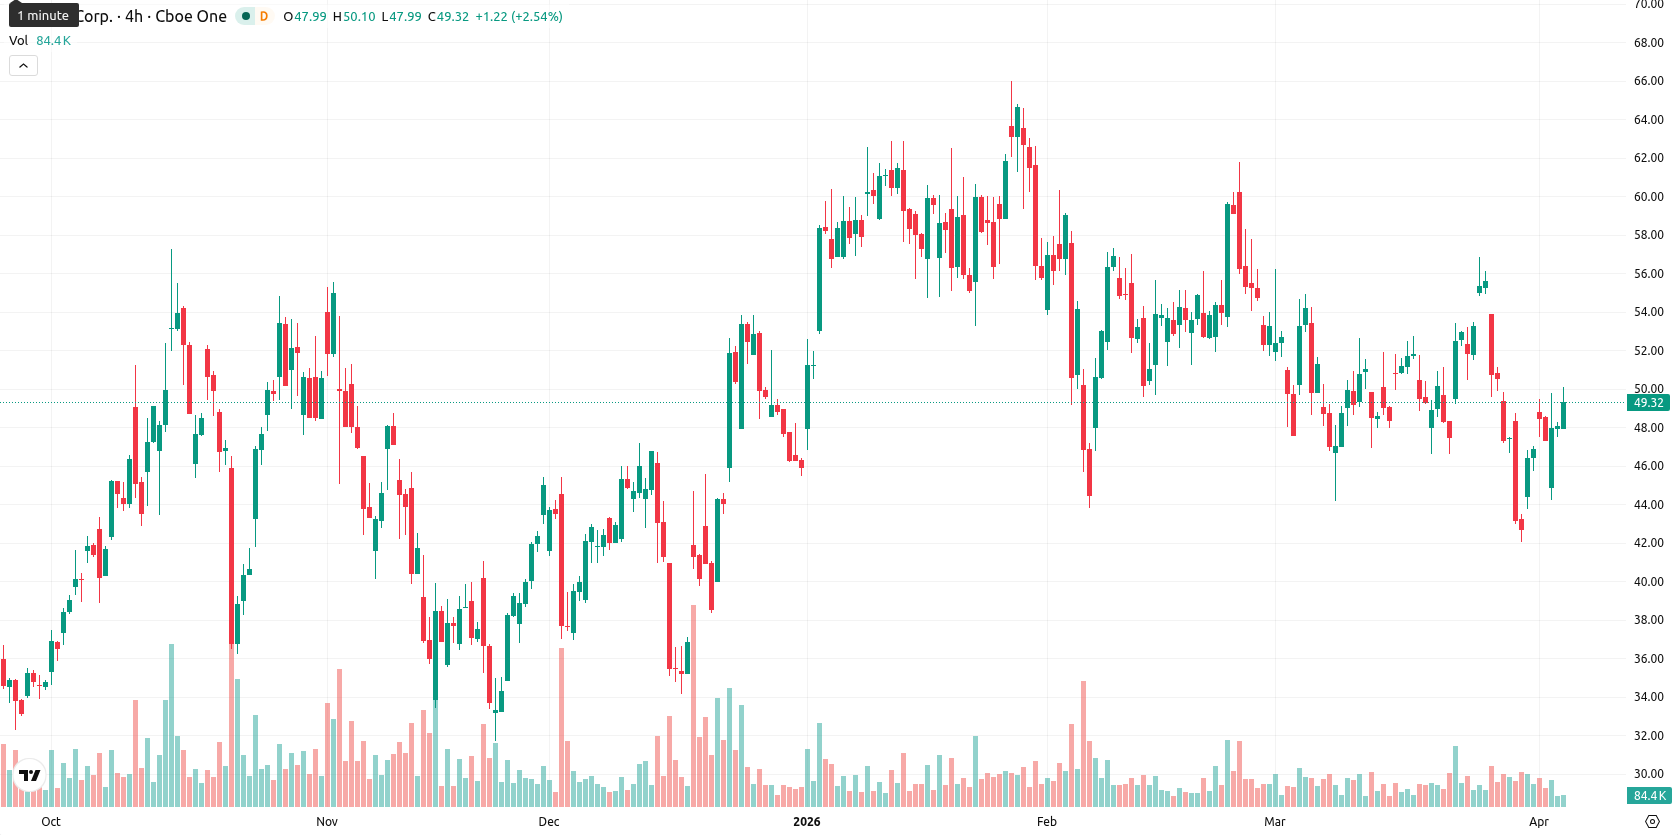
+3.06% for Hut 8 stock as price stays within the $47.00–$52.00 range

Hut 8 Corp (HUT) is trading at $49.58, reflecting a daily gain of 3.06%. The price is just above the SMA-20 of $49.39, well below the SMA-50 at $52.72, and comfortably above the SMA-200 at $39.99, indicating near-term prices are testing short-term resistance while maintaining a long-term bullish structure.
Highlights
- HUT price is consolidating just below immediate resistance, maintaining a long-term bullish structure despite short-term caution.
- Momentum and trend indicators are mixed, with weak trend strength and some overbought signals pointing to near-term indecision.
- Expected price range for the next week is $47.00–$52.00, with a 75% probability of an upward breakout if $50 resistance is cleared.
Conflicting momentum signals amid buyer-driven price advance
Momentum signals for HUT are mixed. The MACD on the daily chart remains bearish and the ADX is weak below 20, indicating muted trend strength. Oscillators also diverge, with RSI and CCI soft at around 47 and -55, respectively, while Stoch RSI is neutral and Bull/Bear Power (BBP) signals strong buyer pressure. After a mild gap up from $48.11 to $48.70, the price advanced toward the session’s range high near $49.90 with moderate volatility, as buyers kept the intraday tone firm. This rise comes despite conflicting momentum readings, signaling short-term caution.
Upside bias as weekly bullish signals outpace daily risks
For the coming week, HUT is expected to trade within a $47.00 – $52.00 volatility band relative to current levels. The probability of an upward move is greater (around 75%), as most weekly indicators remain bullish despite daily divergences. The base case scenario is sideways movement between immediate resistance at $49.96 and support near $47. A bullish breakout above $50 could target $52, while a break below $47 may open a move toward $45 support.
Earlier, analysts noted that Hut 8 was navigating short-term volatility within a broadly supportive long-term trend, with the potential for gains if resistance was cleared. The latest data reinforces this outlook, highlighting that sustained movement above immediate resistance remains pivotal for unlocking further upside.


Latest Hut 8 News


-
 Afghanistan
-
 Albania
-
 Algeria
-
 Angola
-
 Argentina
-
 Armenia
-
 Australia
-
 Austria
-
 Azerbaijan
-
 Bahamas
-
 Bahrain
-
 Bangladesh
-
 Belarus
-
 Belgium
-
 Bolivia
-
 Botswana
-
 Brazil
-
 Brunei
-
 Bulgaria
-
 Cambodia
-
 Cameroon
-
 Canada
-
 Chile
Chile
-
 China
China
-
 Colombia
-
 Congo
Congo
-
 Costa Rica
-
 Cote d'Ivoire
-
 Croatia
-
 Cuba
Cuba
-
 Cyprus
-
 Czechia
-
 DR Congo
-
 Denmark
-
 Dominican Republic
-
 Ecuador
-
 Egypt
Egypt
-
 El Salvador
-
 Estonia
-
 Eswatini
-
 Ethiopia
-
 Finland
-
 France
-
 Georgia
-
 Germany
-
 Ghana
Ghana
-
 Greece
-
 Haiti
Haiti
-
 Hong Kong
-
 Hungary
-
 India
India
-
 Indonesia
-
 Iran, Islamic republic
-
 Iraq
Iraq
-
 Ireland
-
 Israel
-
 Italy
Italy
-
 Jamaica
-
 Japan
Japan
-
 Jordan
-
 Kazakhstan
-
 Kenya
Kenya
-
 Korea
Korea
-
 Kuwait
-
 Kyrgyzstan
-
 Laos
Laos
-
 Latvia
-
 Lebanon
-
 Lesotho
-
 Libya
Libya
-
 Lithuania
-
 Luxembourg
-
 Madagascar
-
 Malaysia
-
 Malta
Malta
-
 Mauritius
-
 Mexico
-
 Moldova
-
 Mongolia
-
 Montenegro
-
 Morocco
-
 Mozambique
-
 Myanmar
-
 Namibia
-
 Nepal
Nepal
-
 Netherlands
-
 New Zealand
-
 Nigeria
-
 North Macedonia
-
 Norway
-
 Oman
Oman
-
 Pakistan
-
 Palestine
-
 Panama
-
 Papua New Guinea
-
 Paraguay
-
 Peru
Peru
-
 Philippines
-
 Poland
-
 Portugal
-
 Puerto Rico
-
 Qatar
Qatar
-
 Reunion
-
 Romania
-
 Rwanda
-
 Saudi Arabia
-
 Serbia
-
 Singapore
-
 Slovakia
-
 Slovenia
-
 Somalia
-
 South Africa
-
 Spain
Spain
-
 Sri Lanka
-
 Sweden
-
 Switzerland
-
 Syria
Syria
-
 Taiwan
-
 Tajikistan
-
 Tanzania
-
 Thailand
-
 Trinidad and Tobago
-
 Tunisia
-
 Turkey
-
 UAE
UAE
-
 Uganda
-
 Ukraine
-
 United Kingdom
-
United States
-
 Uruguay
-
 Uzbekistan
-
 Venezuela
-
 Vietnam
-
 Yemen
Yemen
-
 Zambia
-
 Zimbabwe
- Forex
- Crypto
