

OP news live: intraday volatility high — bearish trend confirmed by MACD and ADX indicators

Optimism (OP) is trading at $0.3007, well below its MA-20 ($0.3348), MA-50 ($0.3840), and MA-200 ($0.6062), indicating persistent short-, medium-, and long-term selling pressure. The nearest dynamic resistance level is the Ichimoku Kijun at $0.3658, with no significant support from higher-period averages nearby.
OP price prediction
Current price:
$0.1026
-0.0058
5.35%
Real-time Data
08:47
Daily range
0.0938
 0.1041
Weekly range
0.0993
0.1160
0.1160
Loading...
Highlights
- OP trades at $0.3007, significantly below MA-20 ($0.3348), MA-50 ($0.3840), and MA-200 ($0.6062), reflecting persistent selling pressure across all timeframes.
- Momentum signals from MACD and ADX remain strongly bearish on both daily and weekly charts, with today’s price dropping 7.65% and closing near session lows.
- Expected five-day trading range is $0.2700 to $0.3300, with a less than 20% probability of price increase and sellers likely to dominate.
Bearish momentum persists amid high volatility and indicator conflict
Momentum signals remain negative, with both MACD and ADX on the daily and weekly timeframes confirming a strong bearish trend. RSI is subdued at 41.6 on the daily and 33.5 on the weekly, while Stoch RSI is in the overbought area on D1 but oversold on most intraday frames, indicating conflicting short-term signals. CCI centers around neutral, while BBP suggests a slight edge for buyers intraday, though overall pressure from sellers is evident given the drop of 7.65% today. There was a minor gap down between the previous close and today’s open, and the current price now trades near the low end of today’s range, reflecting high intraday volatility and clear pressure after the open.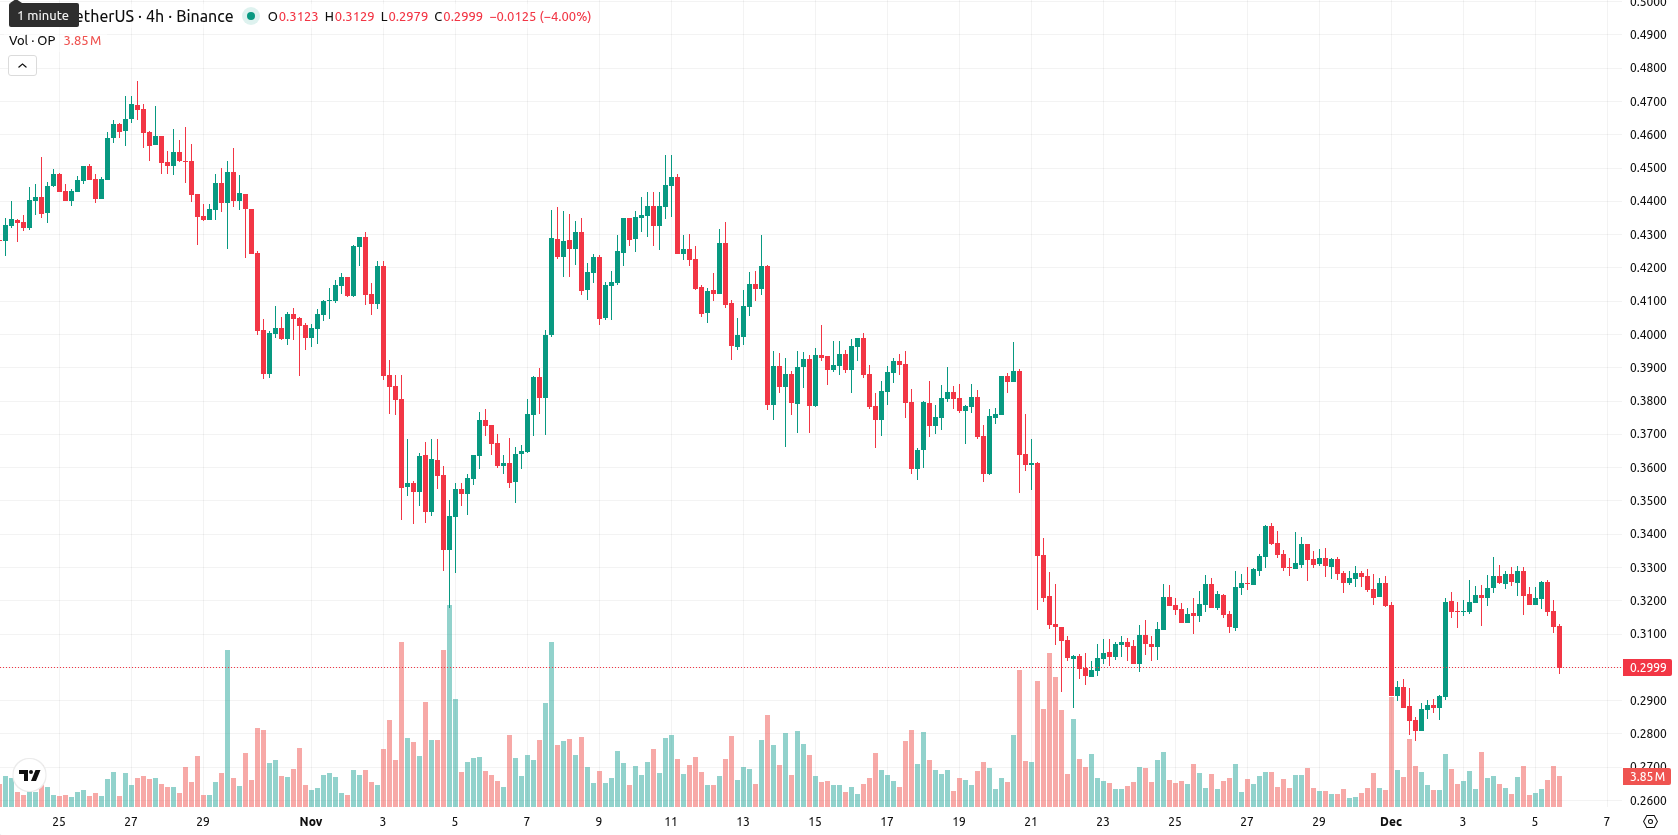
Downside risk dominates as sellers set consolidation boundaries
For the next five trading days, the expected range is $0.2700 to $0.3300, normalized to reflect recent price action. The probability of a price increase is very low (less than 20%), with a price decrease being far more likely. The baseline scenario is for OP to consolidate sideways within this corridor as sellers dominate. A bullish scenario would require a decisive move above resistance at $0.3300 — $0.3658, but momentum does not currently support this. On the bearish side, a break below $0.2700 could trigger further declines, especially if negative sentiment persists.
Viktoras Karapetjanc, analyst at Traders Union, sees persistent bearish momentum in Optimism (OP) as the price lags well below key moving averages. He believes heavy selling pressure and a lack of fundamental news reinforce the negative sentiment, despite some intraday volatility. Karapetjanc notes that unless OP reclaims the $0.3300 — $0.3658 band, downside risk remains dominant. Still, he keeps an optimistic view on the broader sector. "If buyers step in and OP clears resistance, we could see the tide turn — but for now, consolidation appears most likely."
Previously it was reported that Optimism (OP) remains under sustained bearish pressure, trading below key moving averages across all timeframes with short-term momentum indicators showing sellers still dominate. Resistance persists near the Ichimoku Kijun while oscillators such as the MACD and Stoch RSI indicate ongoing weakness despite a sharp intraday rally of 11.56%.
Source of Data:
OP Price Analysis by TU
The analysis is based on a proprietary model combining technical, on-chain, and expert data. Not investment advice. See
methodology
The information is based on forecasts and does not constitute investment advice or a guarantee of future results. Market conditions may change. See our Disclaimer and Editorial Integrity for details.
Subscribe to TU news


Did you like the article?






Top News


Top 5 companies for you

United States
-
 Afghanistan
-
 Albania
-
 Algeria
-
 Angola
-
 Argentina
-
 Armenia
-
 Australia
-
 Austria
-
 Azerbaijan
-
 Bahamas
-
 Bahrain
-
 Bangladesh
-
 Belarus
-
 Belgium
-
 Bolivia
-
 Botswana
-
 Brazil
-
 Brunei
-
 Bulgaria
-
 Cambodia
-
 Cameroon
-
 Canada
-
 Chile
-
 China
-
 Colombia
-
 Congo
-
 Costa Rica
-
 Cote d'Ivoire
-
 Croatia
-
 Cuba
-
 Cyprus
-
 Czechia
-
 DR Congo
-
 Denmark
-
 Dominican Republic
-
 Ecuador
-
 Egypt
-
 El Salvador
-
 Estonia
-
 Eswatini
-
 Ethiopia
-
 Finland
-
 France
-
 Georgia
-
 Germany
-
 Ghana
-
 Greece
-
 Haiti
-
 Hong Kong
-
 Hungary
-
 India
-
 Indonesia
-
 Iran, Islamic republic
-
 Iraq
-
 Ireland
-
 Israel
-
 Italy
-
 Jamaica
-
 Japan
-
 Jordan
-
 Kazakhstan
-
 Kenya
-
 Korea
-
 Kuwait
-
 Kyrgyzstan
-
 Laos
-
 Latvia
-
 Lebanon
-
 Lesotho
-
 Libya
-
 Lithuania
-
 Luxembourg
-
 Madagascar
-
 Malaysia
-
 Malta
-
 Mauritius
-
 Mexico
-
 Moldova
-
 Mongolia
-
 Montenegro
-
 Morocco
-
 Mozambique
-
 Myanmar
-
 Namibia
-
 Nepal
-
 Netherlands
-
 New Zealand
-
 Nigeria
-
 North Macedonia
-
 Norway
-
 Oman
-
 Pakistan
-
 Palestine
-
 Panama
-
 Papua New Guinea
-
 Paraguay
-
 Peru
-
 Philippines
-
 Poland
-
 Portugal
-
 Puerto Rico
-
 Qatar
-
 Reunion
-
 Romania
-
 Rwanda
-
 Saudi Arabia
-
 Serbia
-
 Singapore
-
 Slovakia
-
 Slovenia
-
 Somalia
-
 South Africa
-
 Spain
-
 Sri Lanka
-
 Sweden
-
 Switzerland
-
 Syria
-
 Taiwan
-
 Tajikistan
-
 Tanzania
-
 Thailand
-
 Trinidad and Tobago
-
 Tunisia
-
 Turkey
-
 UAE
-
 Uganda
-
 Ukraine
-
 United Kingdom
-
United States
-
 Uruguay
-
 Uzbekistan
-
 Venezuela
-
 Vietnam
-
 Yemen
-
 Zambia
-
 Zimbabwe
- Forex
- Crypto










Live News


